Article · Education research
Acceptance is not use: what surveys on AI in schools actually measure
© Pablo Correa Prieto, 2026 — CC BY 4.0
When an institution wants to know whether teachers use generative AI, it sends out a questionnaire. And that questionnaire is almost always built on the same model, the technology acceptance model. The problem is not the model. It is the gap between what it measures and what it is asked to say.
1.What the model actually measures
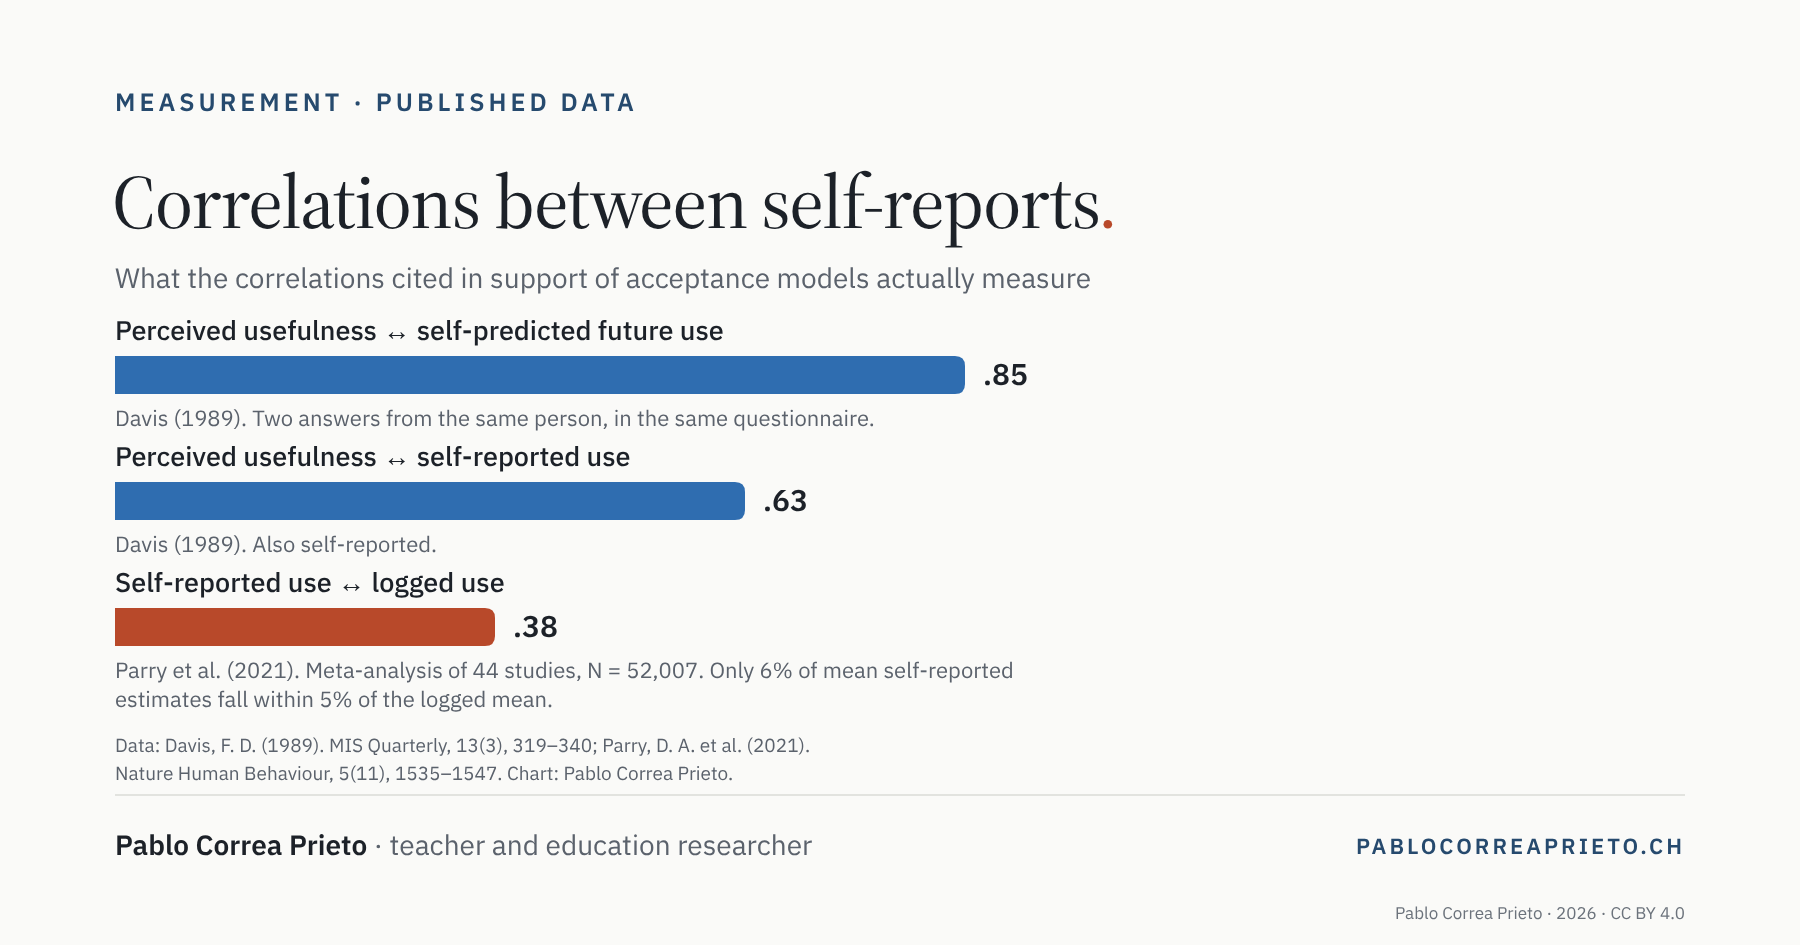
The founding article of this tradition establishes two variables, perceived usefulness and perceived ease of use, and relates them to system use (Davis, 1989). Two correlations are reported: .63 between perceived usefulness and the use participants reported, and .85 between perceived usefulness and the future use participants predicted for themselves.
It is the second figure that went down in history, cited as proof that the model predicts use. It should be read for what it is: a correlation between two answers given by the same person in the same questionnaire. It is not a measure of behaviour, it is the internal consistency of a self-report.
The unified model that followed reports 69% to 70% of variance explained (Venkatesh et al., 2003). That variance is in the intention to use, not in use. The distinction disappears almost systematically when the result is passed along.
© Pablo Correa Prieto, 2026 — CC BY 4.0
2.The gap between what we say and what we do
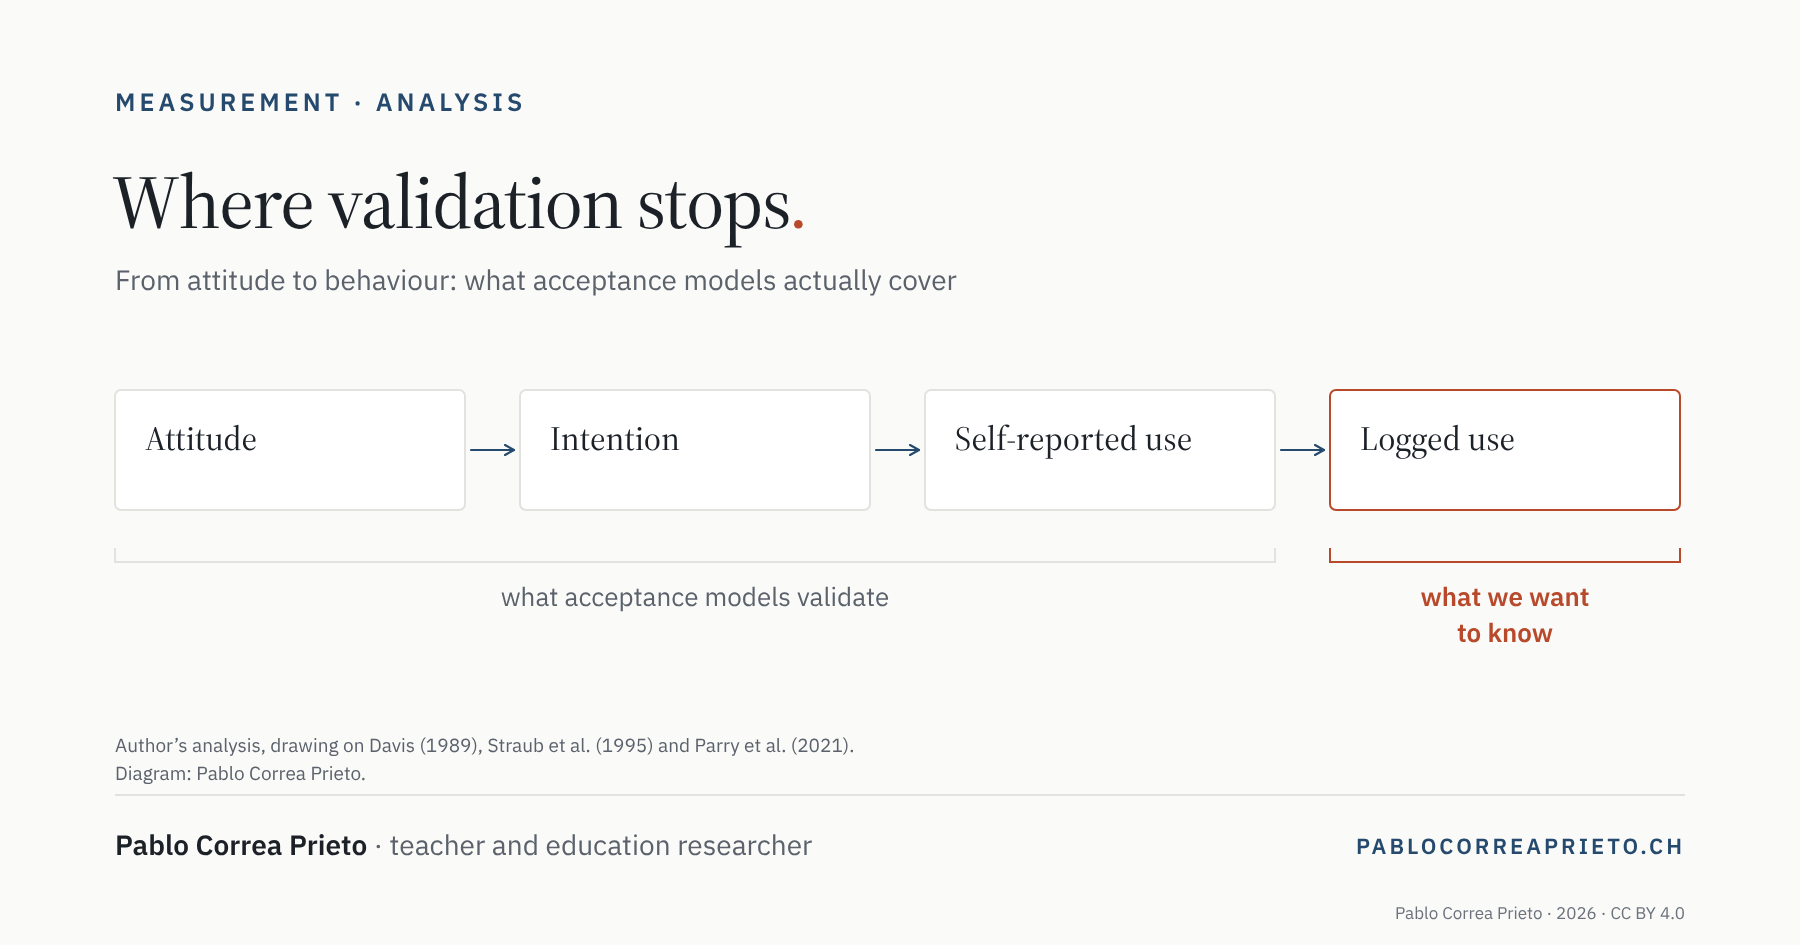
The question was raised early, and within the same literature. A study in Management Science argues that self-reported use and computer-recorded use are two distinct constructs and that, contrary to expectation, they do not appear to be strongly related to each other (Straub et al., 1995). Objective measures show distinctly weaker links with the model’s variables than self-reported ones do. The authors draw the consequence themselves: research confirming the model from subjective measures may be, in their word, artifactual.
Thirty years later, a meta-analysis in Nature Human Behaviour gathered the studies comparing self-reported digital media use with logged use (Parry et al., 2021). Across 44 studies and more than 52,000 participants, the pooled correlation is .38. Self-report therefore accounts for about 14% of the variance in actual use. More telling still: only 6% of mean self-reported estimates fell within 5% of the logged mean.
© Pablo Correa Prieto, 2026 — CC BY 4.0
One detail of that meta-analysis deserves attention. The bias is not systematic, since participants do not reliably overestimate their use and the confidence interval of the ratio between reported and logged use contains 1. A constant bias could be corrected for. A noisy one cannot.
A more recent study finds the same profile, with an additional result (Coyne et al., 2023). The more an instrument resembles an attitude scale, the less it tracks recorded behaviour: scales of problematic use, nomophobia and fear of missing out correlated between .02 and .10 with the objective data, where a simple duration estimate reached .51. The sample was young adults rather than teachers, which limits how far the figure travels, but the mechanism is the one that concerns us.
3.Surveys of teachers do exactly this
A 2026 study of 218 in-service primary and secondary teachers applies an extended acceptance model to generative AI (Tang & Zhong, 2026). The dependent variable is the intention to use, or to keep using, the tool. No data on actual use is collected, even though the sample consists of teachers, some of whom already use these tools.
A German-language study goes a little further and measures both intention and use (Dietrich & Grassini, 2025). But use there is a self-reported frequency on a seven-point scale, collected in the same instrument as intention. Its most interesting result concerns the 56 teachers in the sample: among them the model’s classic predictors drop out, and it is habit that predicts use as strongly as intention does. The sample is small for the method used, and I would not take it as a demonstration. But the direction is instructive: as soon as the dependent variable moves even slightly towards behaviour, the acceptance constructs lose their grip.
4.What this changes for a cantonal survey
An acceptance survey tells you about attitudes. That is real and useful information, for deciding on training provision or on how to communicate. It does not tell you what happens in classrooms, and treating it as a usage figure is a reading error, not an approximation.
If the question is about practice, you need traces of practice: lesson plans and materials actually produced, interviews about last week’s lessons rather than about intentions, observation. Each of these costs more than a questionnaire, and some routes are closed. The Romandie recommendations forbid putting students’ work into a generative AI tool as long as the canton does not provide one whose reliability is guaranteed (CIIP, 2025).
None of this is an argument against acceptance models. They predict well what they predict, and intention matters. It is an argument against a substitution: reading an acceptance score as a usage rate.
Let’s talk
If you run or read this kind of survey in French-speaking Switzerland, I would be glad to discuss it. My contact details: pablocorreaprieto.ch
Text written with the help of AI, reviewed and approved by the author.
References
- CIIP. (2025). Intelligence artificielle générative – IAG : recommandations pour une utilisation réfléchie et mesurée dans l’enseignement [Generative artificial intelligence: recommendations for considered and measured use in teaching]. Conférence intercantonale de l’instruction publique de la Suisse romande et du Tessin. https://www.ciip.ch/files/1050/Documents/IRDP/Recommandations_IAG_19-03-2025_V10.pdf
- Coyne, P., Voth, J., & Woodruff, S. J. (2023). A comparison of self-report and objective measurements of smartphone and social media usage. Telematics and Informatics Reports, 10, Article 100061. https://doi.org/10.1016/j.teler.2023.100061
- Davis, F. D. (1989). Perceived usefulness, perceived ease of use, and user acceptance of information technology. MIS Quarterly, 13(3), 319–340. https://doi.org/10.2307/249008
- Dietrich, L. K., & Grassini, S. (2025). Assessing ChatGPT acceptance and use in education: A comparative study among german-speaking students and teachers. Education and Information Technologies, 30(15), 22151–22176. https://doi.org/10.1007/s10639-025-13658-7
- Parry, D. A., Davidson, B. I., Sewall, C. J. R., Fisher, J. T., Mieczkowski, H., & Quintana, D. S. (2021). A systematic review and meta-analysis of discrepancies between logged and self-reported digital media use. Nature Human Behaviour, 5(11), 1535–1547. https://doi.org/10.1038/s41562-021-01117-5
- Straub, D., Limayem, M., & Karahanna-Evaristo, E. (1995). Measuring system usage: Implications for IS theory testing. Management Science, 41(8), 1328–1342. https://doi.org/10.1287/mnsc.41.8.1328
- Tang, Y., & Zhong, L. (2026). K-12 teachers’ adoption of generative AI for teaching: An extended TAM perspective. Education Sciences, 16(1), Article 136. https://doi.org/10.3390/educsci16010136
- Venkatesh, V., Morris, M. G., Davis, G. B., & Davis, F. D. (2003). User acceptance of information technology: Toward a unified view. MIS Quarterly, 27(3), 425–478. https://doi.org/10.2307/30036540