pablo correa prieto.

Home / Figures

Figures

Figures

The original figures published on this site — with my articles on artificial intelligence in education and on my research and training pages — gathered on one page. Each one can be reused under the CC BY 4.0 licence; the conditions and how to credit are on the Figure reuse page.

Detecting AI in a student’s work: why reliability is not the question
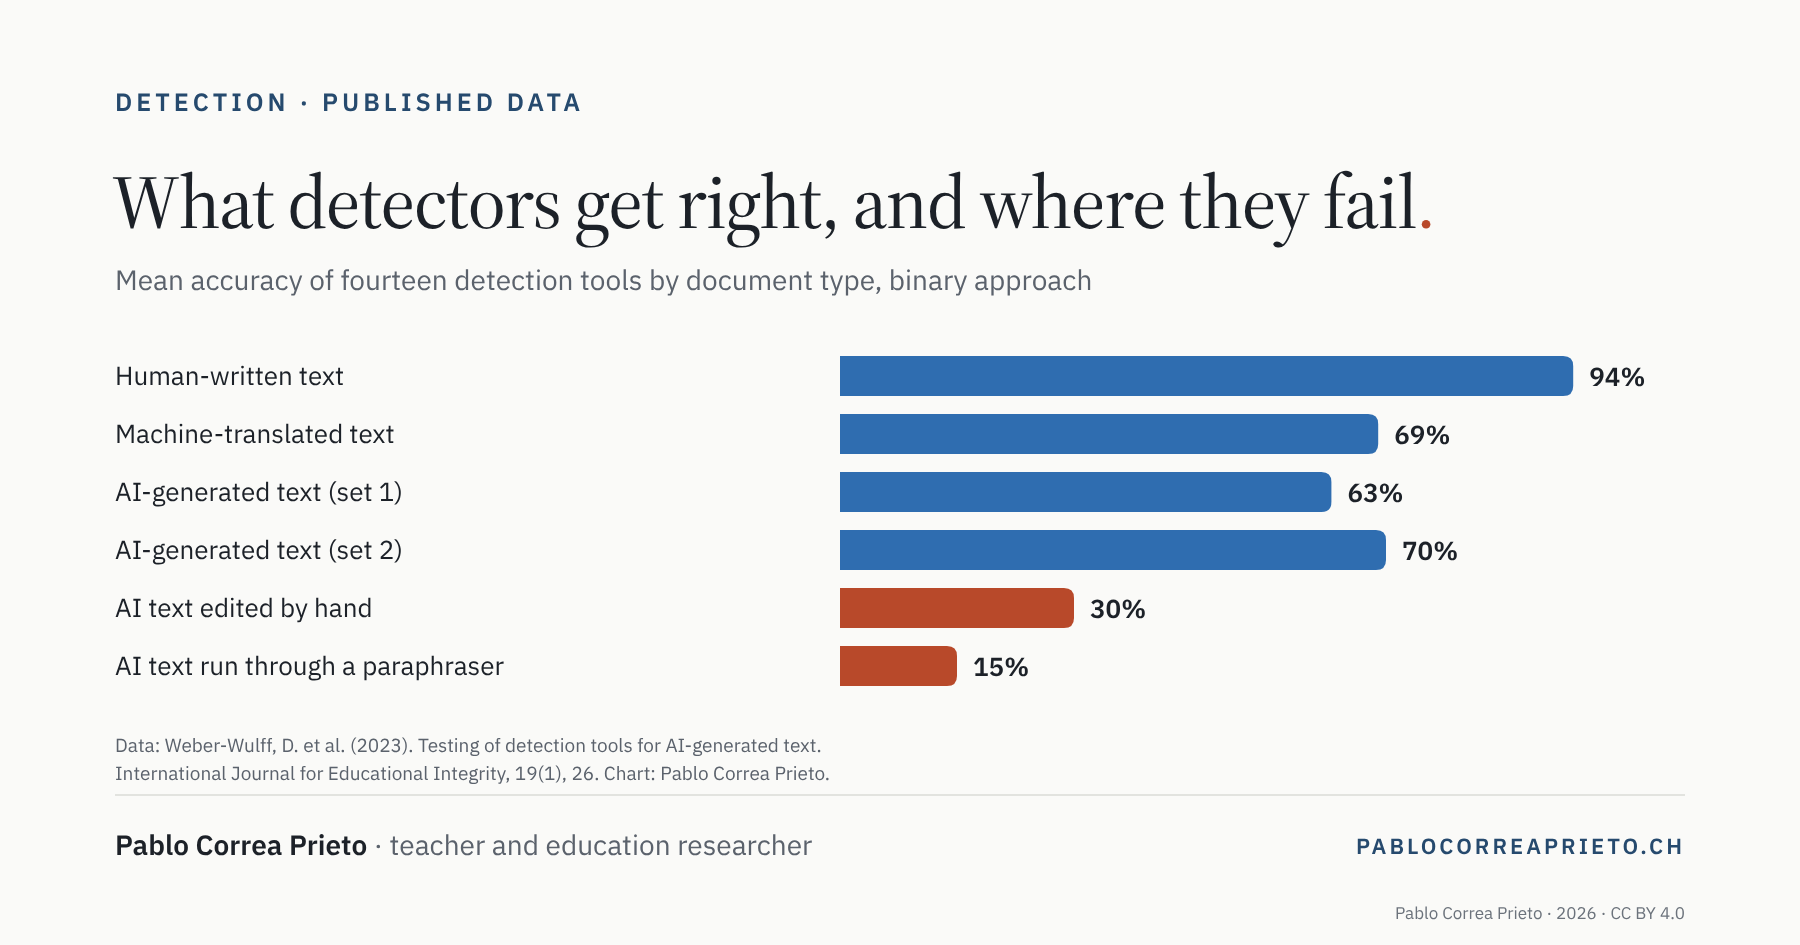
Bar chart: mean accuracy of fourteen detectors by document type, from 94% on human-written text to 15% on AI text run through an automatic paraphraser
Mean accuracy of fourteen detectors by document type, binary approach. Data: Weber-Wulff et al. (2023).
© Pablo Correa Prieto, 2026 — CC BY 4.0
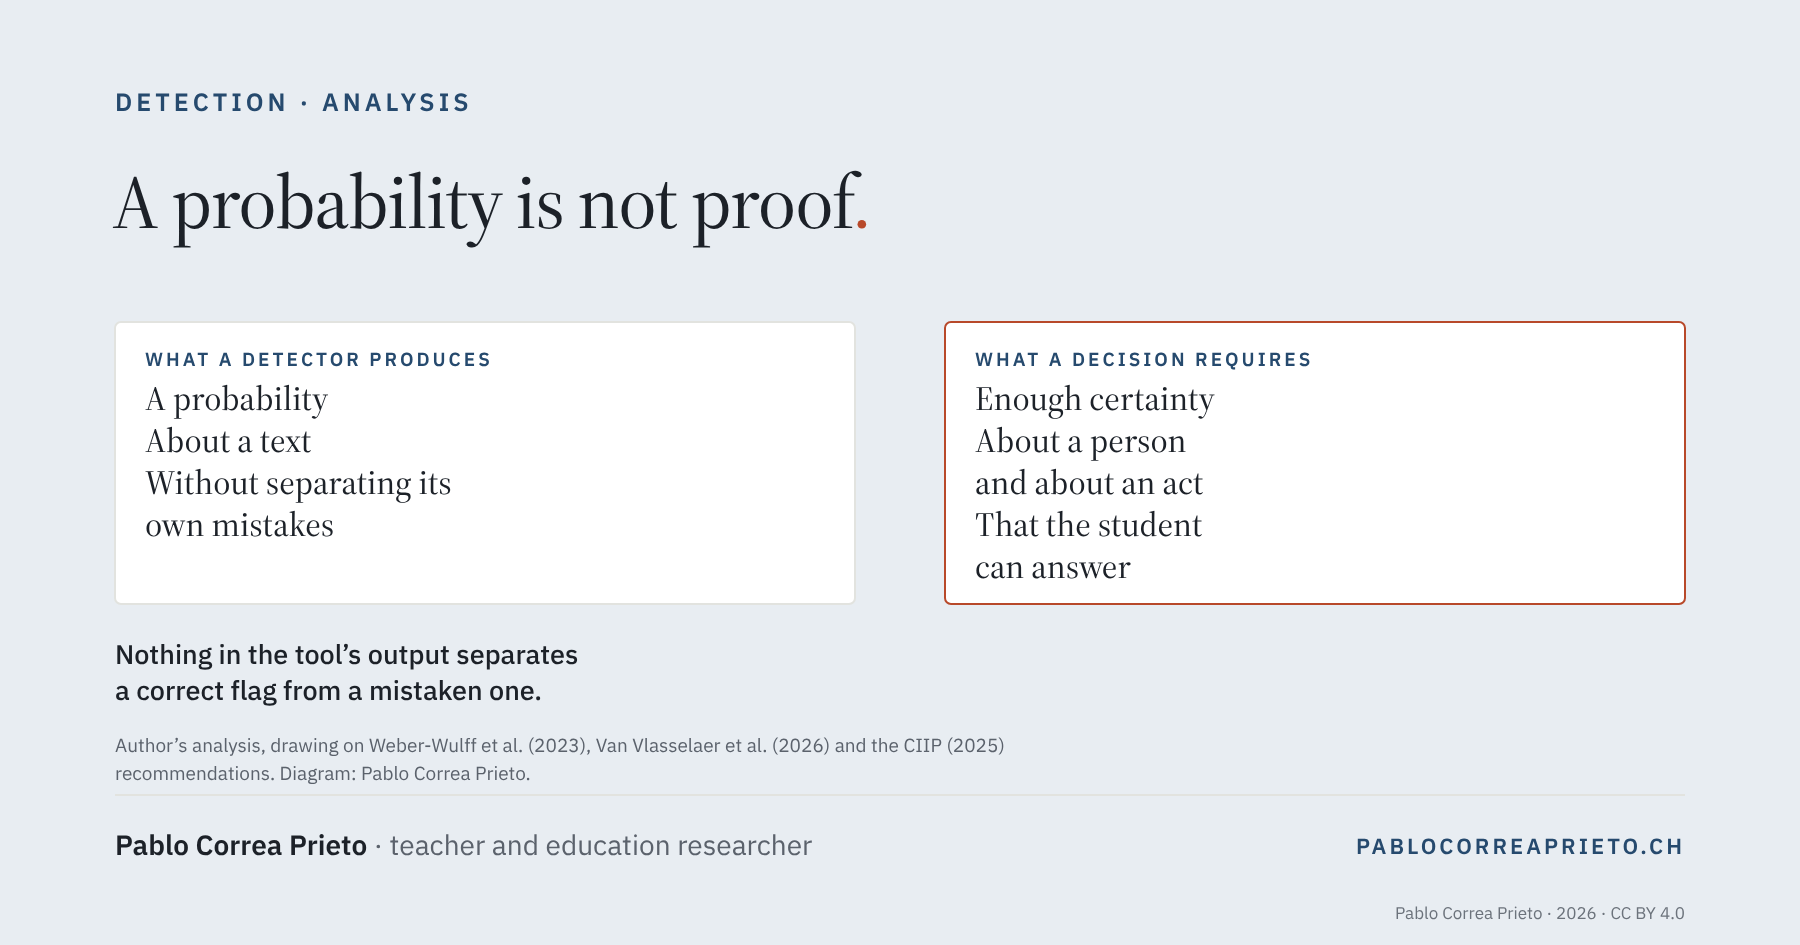
Two columns comparing what a detector produces (a probability, about a text, without separating its own mistakes) and what a decision requires
Why a detector’s output does not convert into a decision.
© Pablo Correa Prieto, 2026 — CC BY 4.0

What makes a response work: the information, not the grade
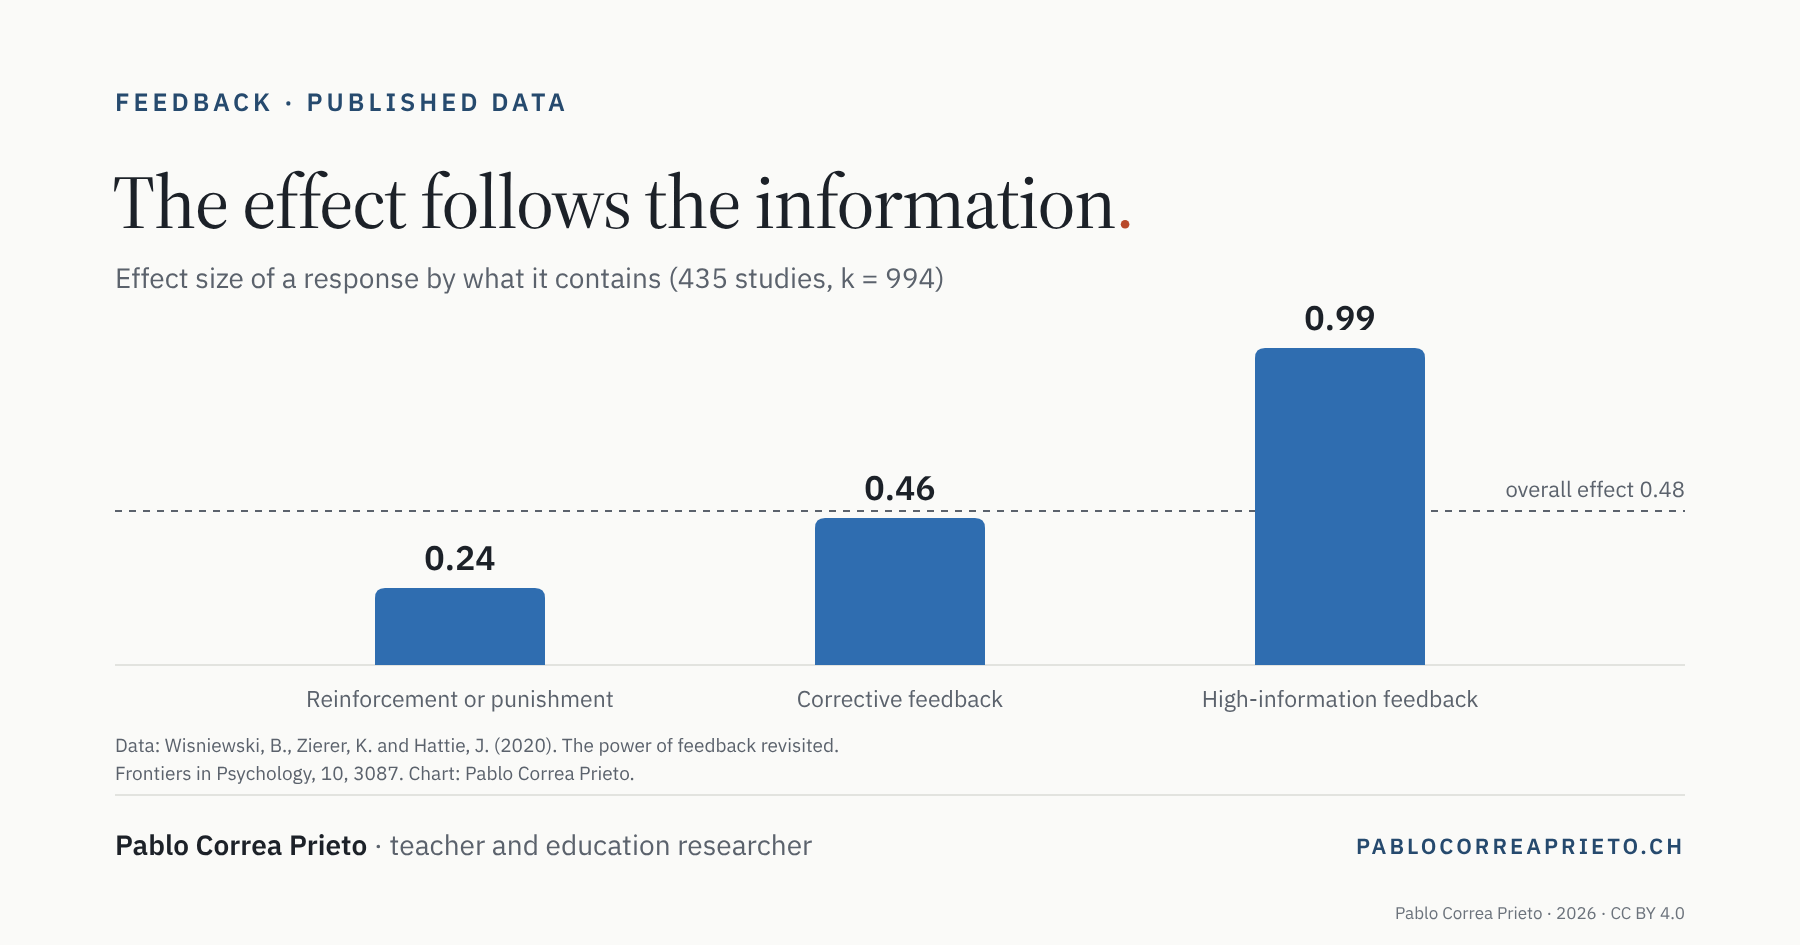
Bar chart: effect size of a response by its content, 0.24 for reinforcement or punishment, 0.46 for corrective feedback and 0.99 for high-information feedback
The more information a response carries, the larger its effect. Data: Wisniewski et al. (2020).
© Pablo Correa Prieto, 2026 — CC BY 4.0
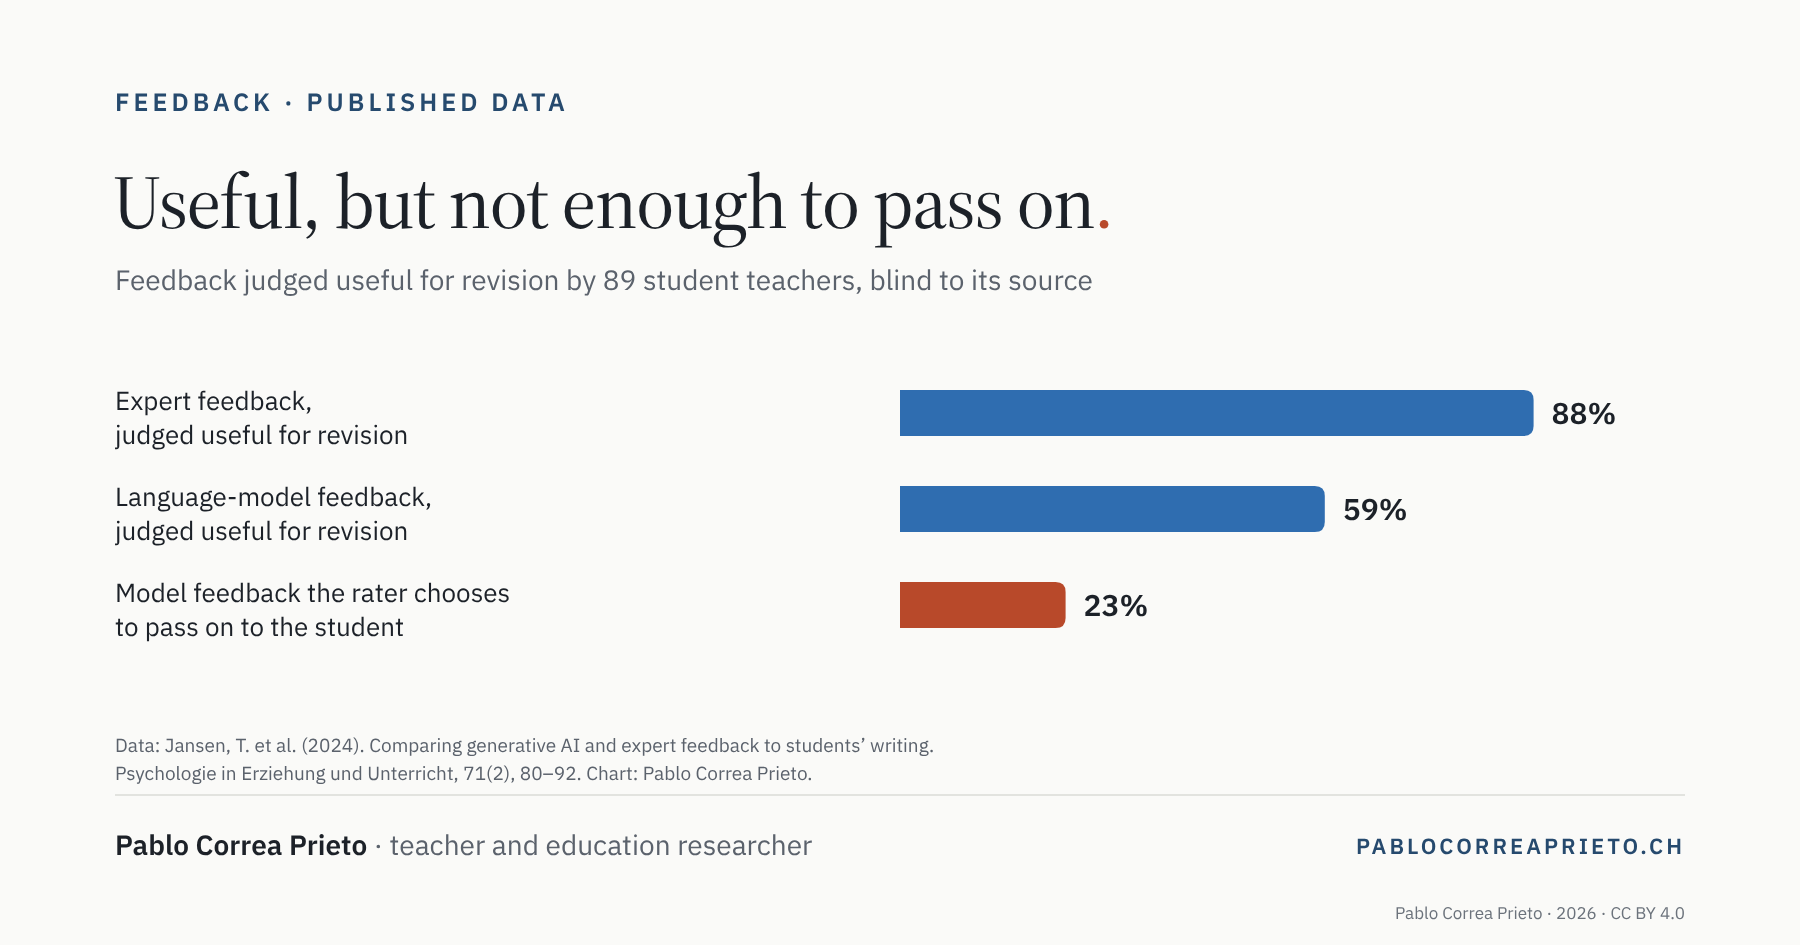
Bar chart: expert feedback judged useful for revision in 88% of texts, language-model feedback in 59%, and passed on to the student in 23% of cases
Feedback judged useful for revision, raters blind to the source. Data: Jansen et al. (2024).
© Pablo Correa Prieto, 2026 — CC BY 4.0

Acceptance is not use: what surveys on AI in schools actually measure
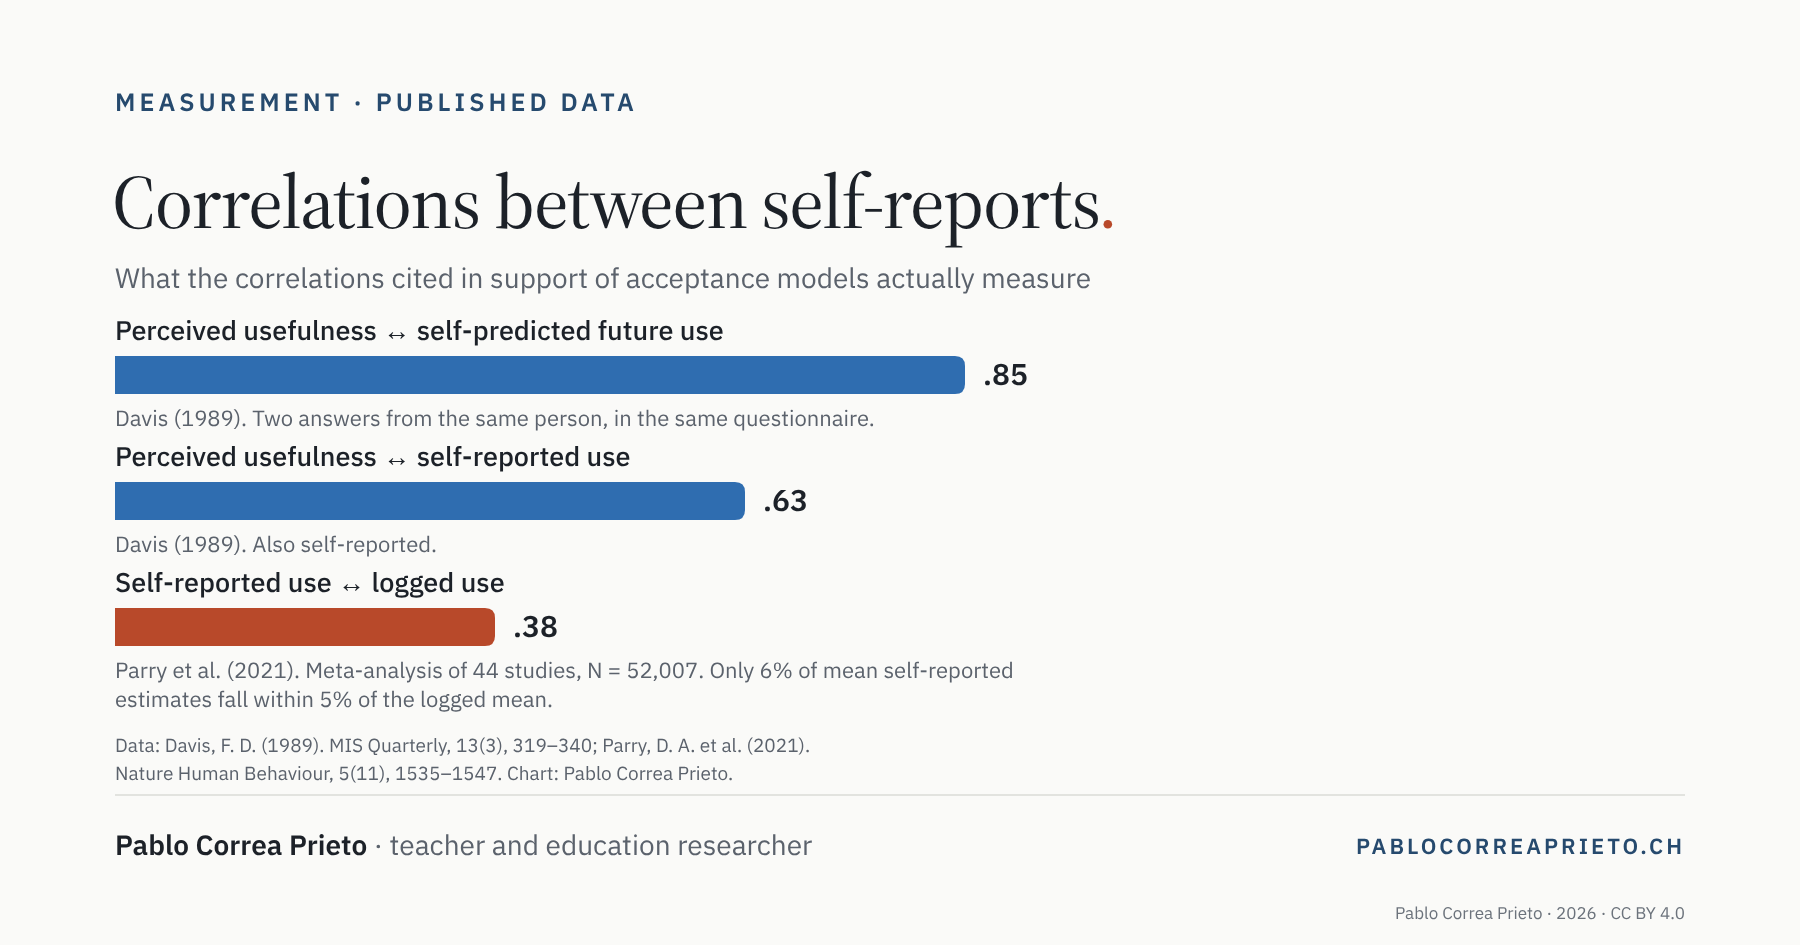
Bar chart comparing three correlations: .85 between perceived usefulness and self-predicted future use, .63 between perceived usefulness and self-reported use, and .38 between self-reported use and logged use
The correlations the model rests on are between self-reports. Data: Davis (1989) and Parry et al. (2021).
© Pablo Correa Prieto, 2026 — CC BY 4.0
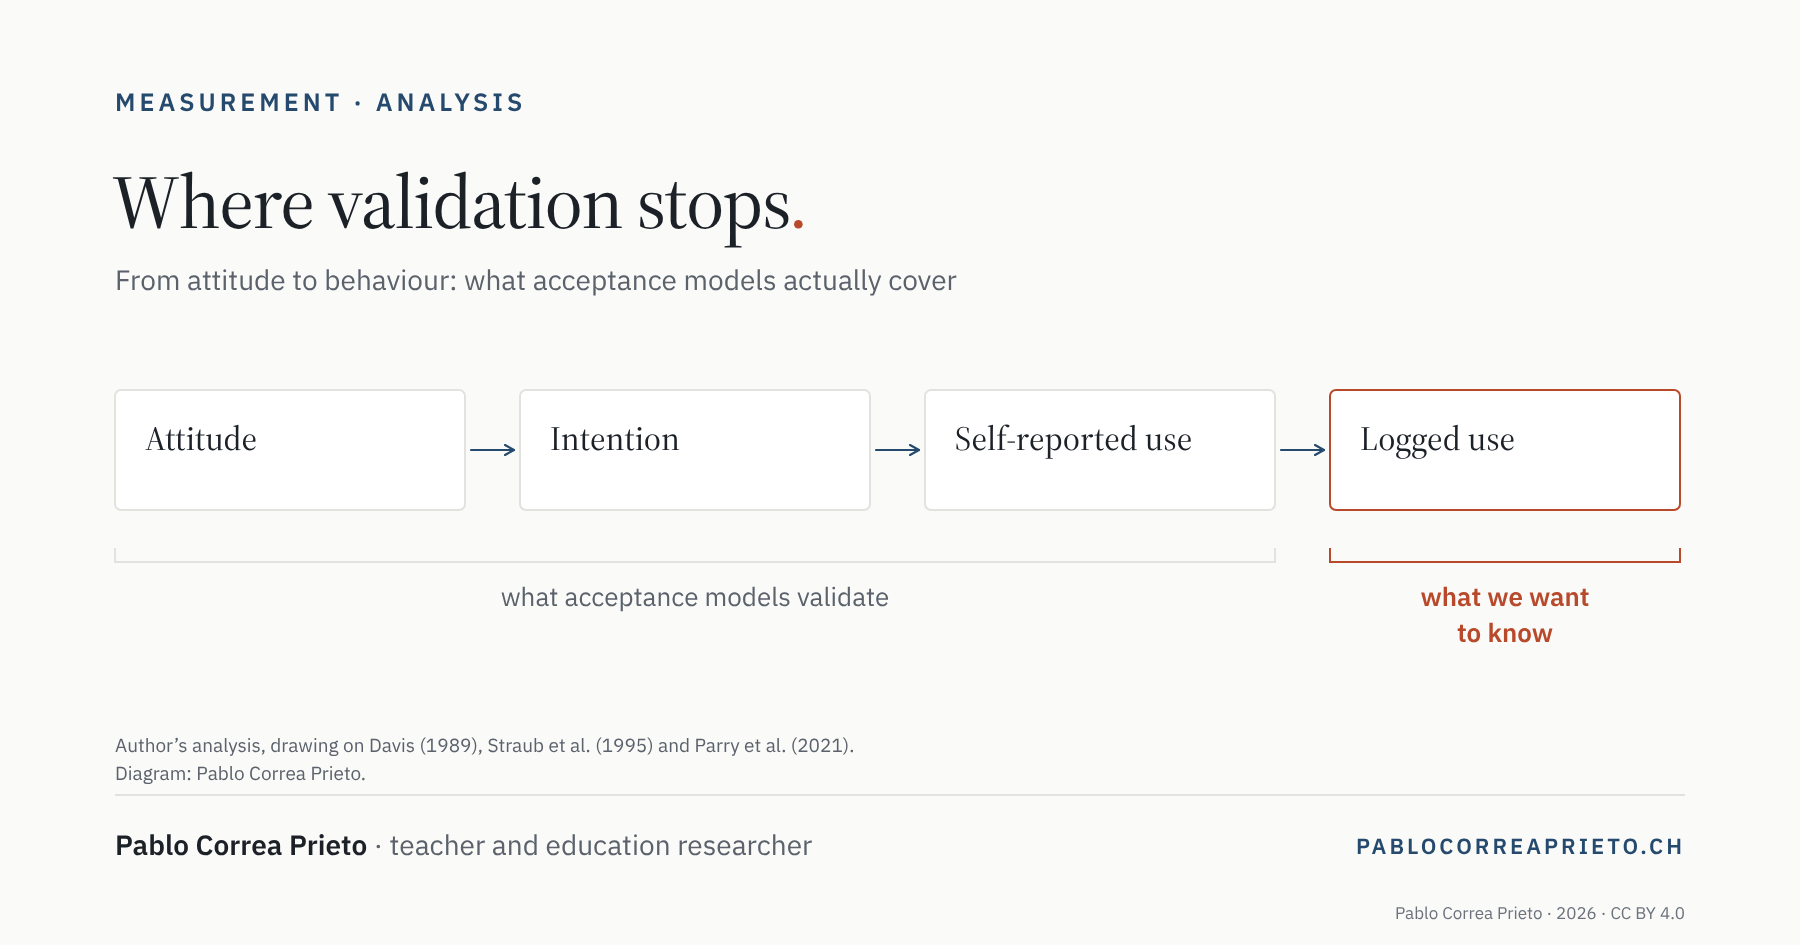
A four-link chain from attitude to logged use, with a bracket showing that model validation covers the first three links and stops before the last
Where the validation of acceptance models stops.
© Pablo Correa Prieto, 2026 — CC BY 4.0

Marking with AI: compare it with our real errors, not with perfection
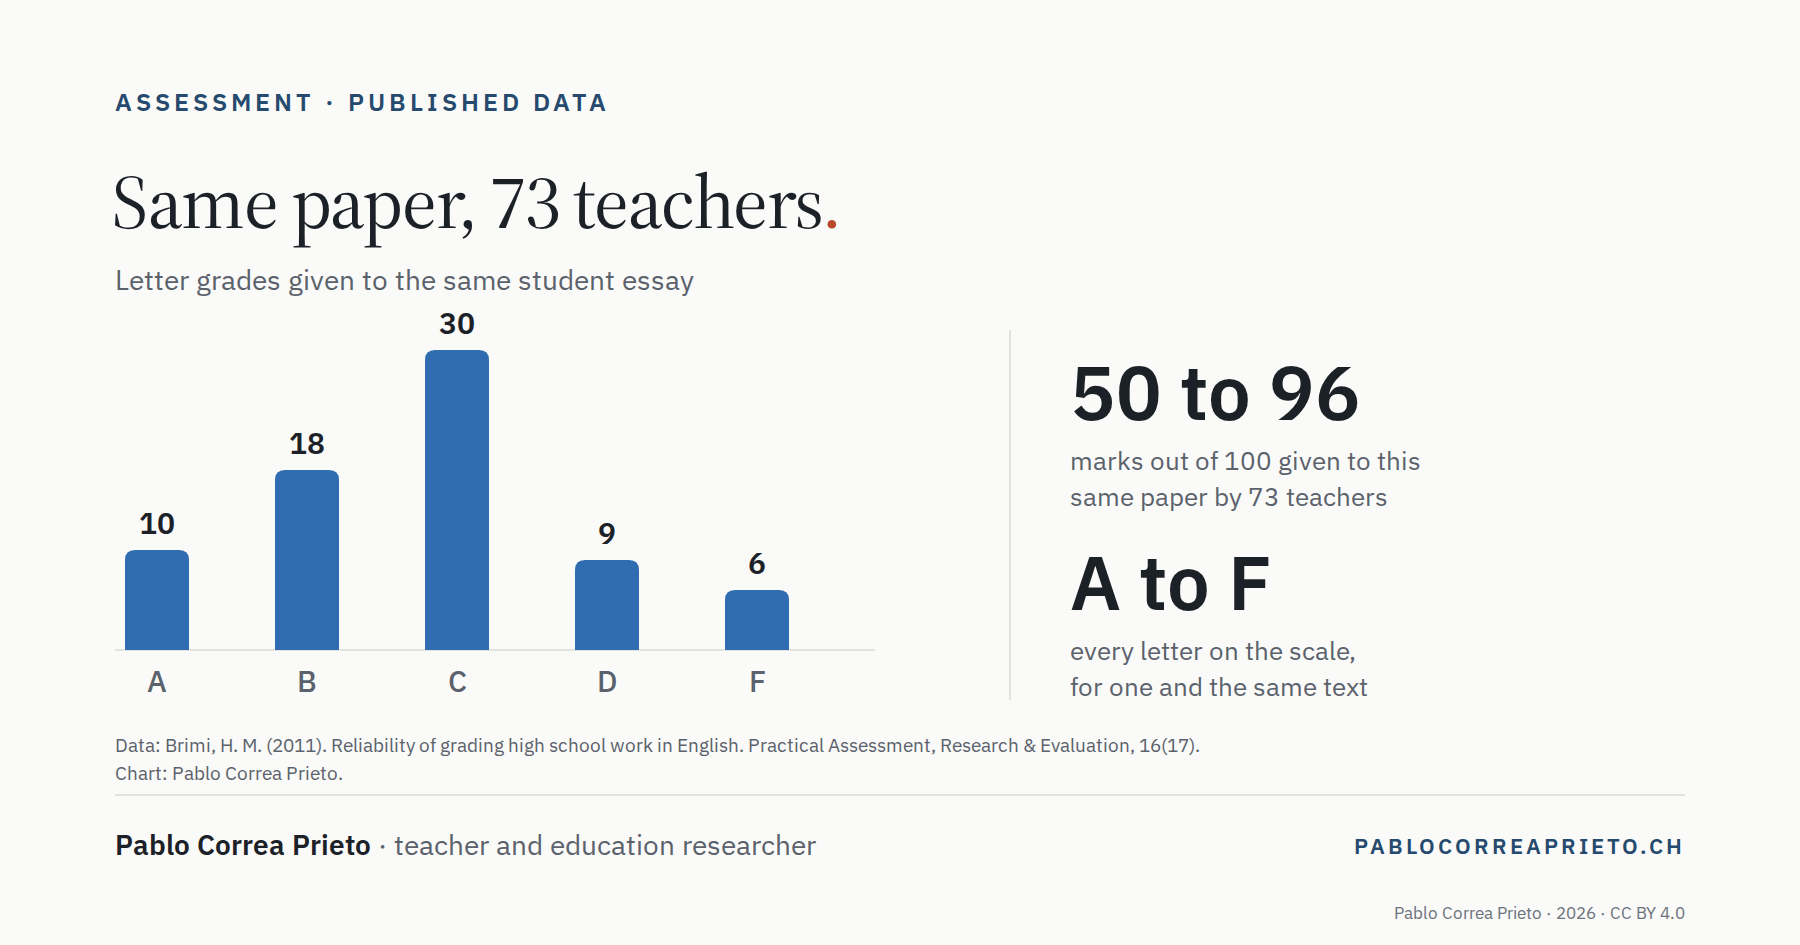
Bar chart: of 73 teachers who marked the same essay, 10 gave an A, 18 a B, 30 a C, 9 a D and 6 an F; out of 100, marks ranged from 50 to 96
Same paper, 73 teachers: grades from A to F. Data: Brimi (2011).
© Pablo Correa Prieto, 2026 — CC BY 4.0
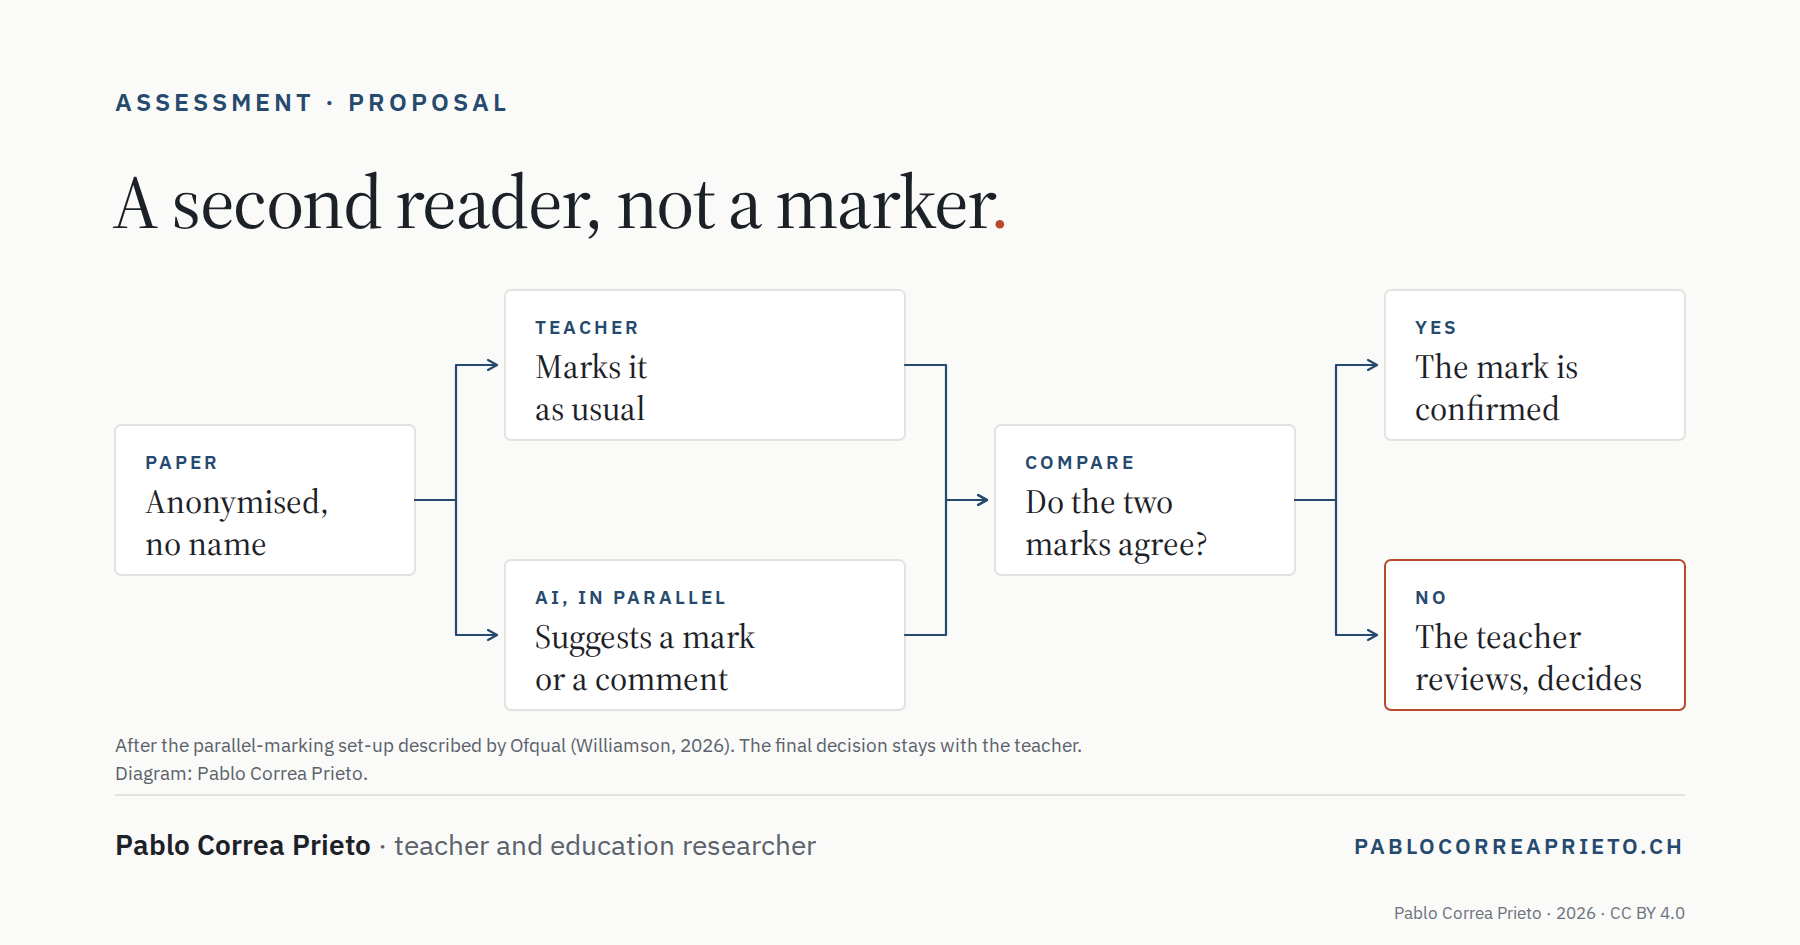
Diagram: an anonymised paper is marked by the teacher and, in parallel, by AI; if the two marks agree, the mark is confirmed; if not, the teacher reviews the paper and decides
The second reader: AI marks in parallel, the teacher reviews the disagreements and decides.
© Pablo Correa Prieto, 2026 — CC BY 4.0

A correct item is not necessarily aligned: three questions for judging an assessment item
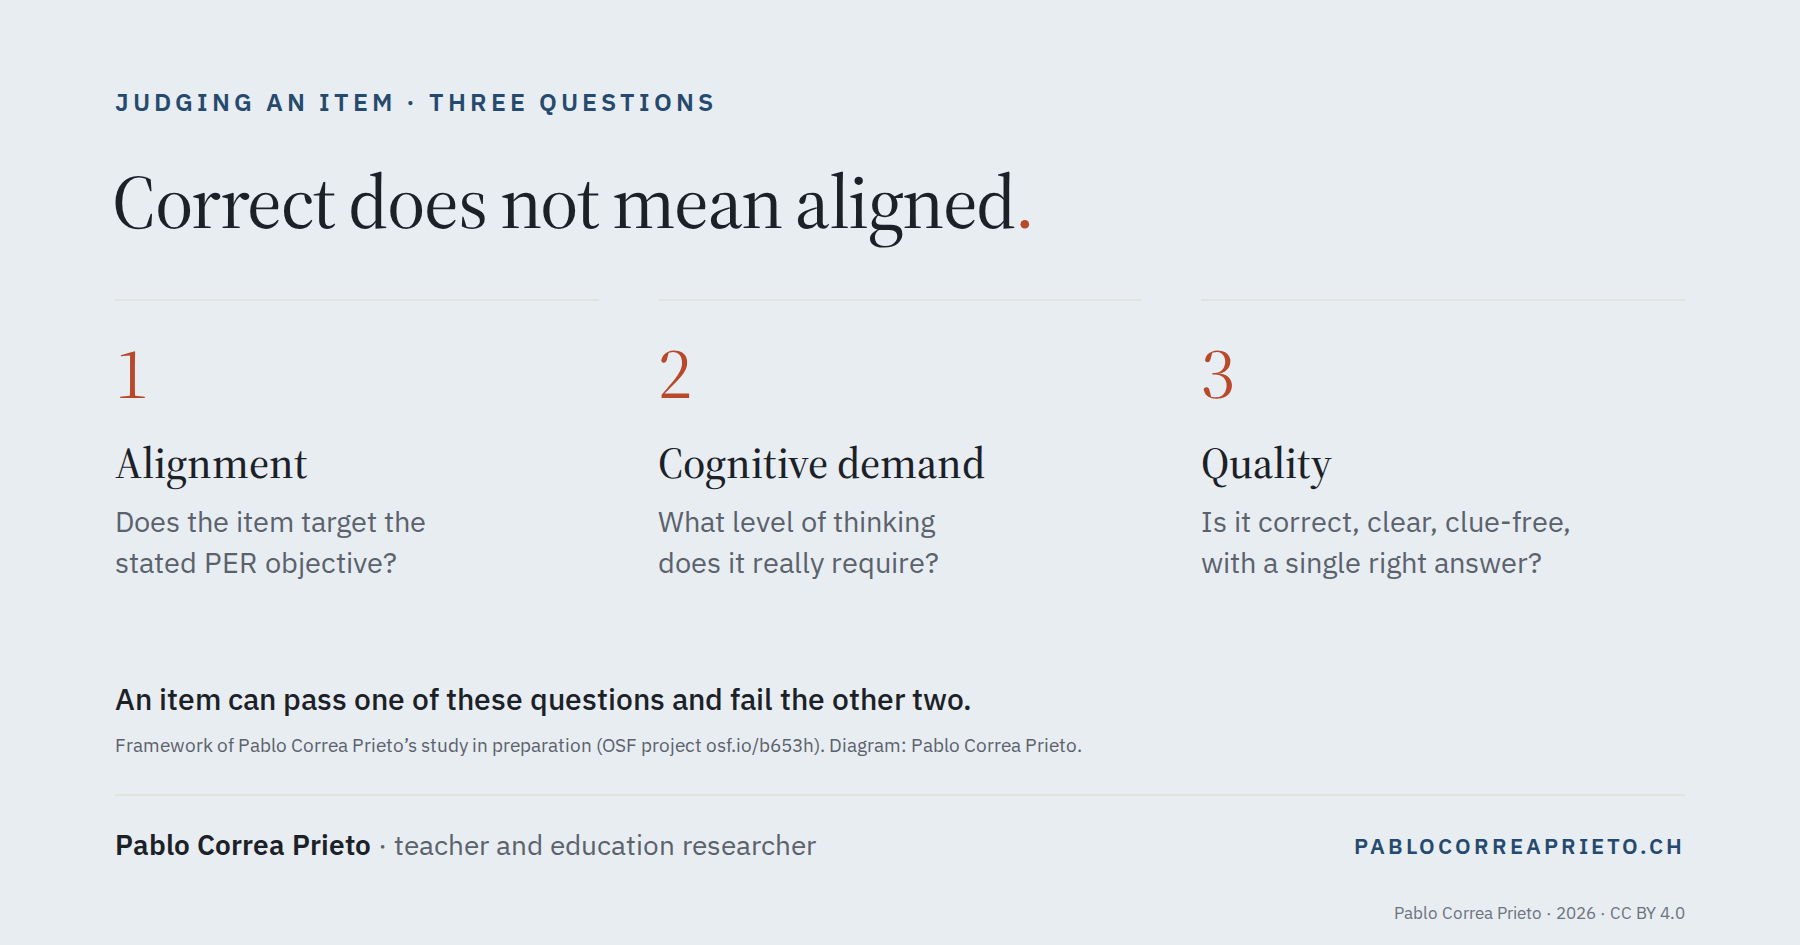
Three numbered columns, “Alignment”, “Cognitive demand” and “Quality”, each with the question to ask about the item
Three separate questions for judging an assessment item.
© Pablo Correa Prieto, 2026 — CC BY 4.0
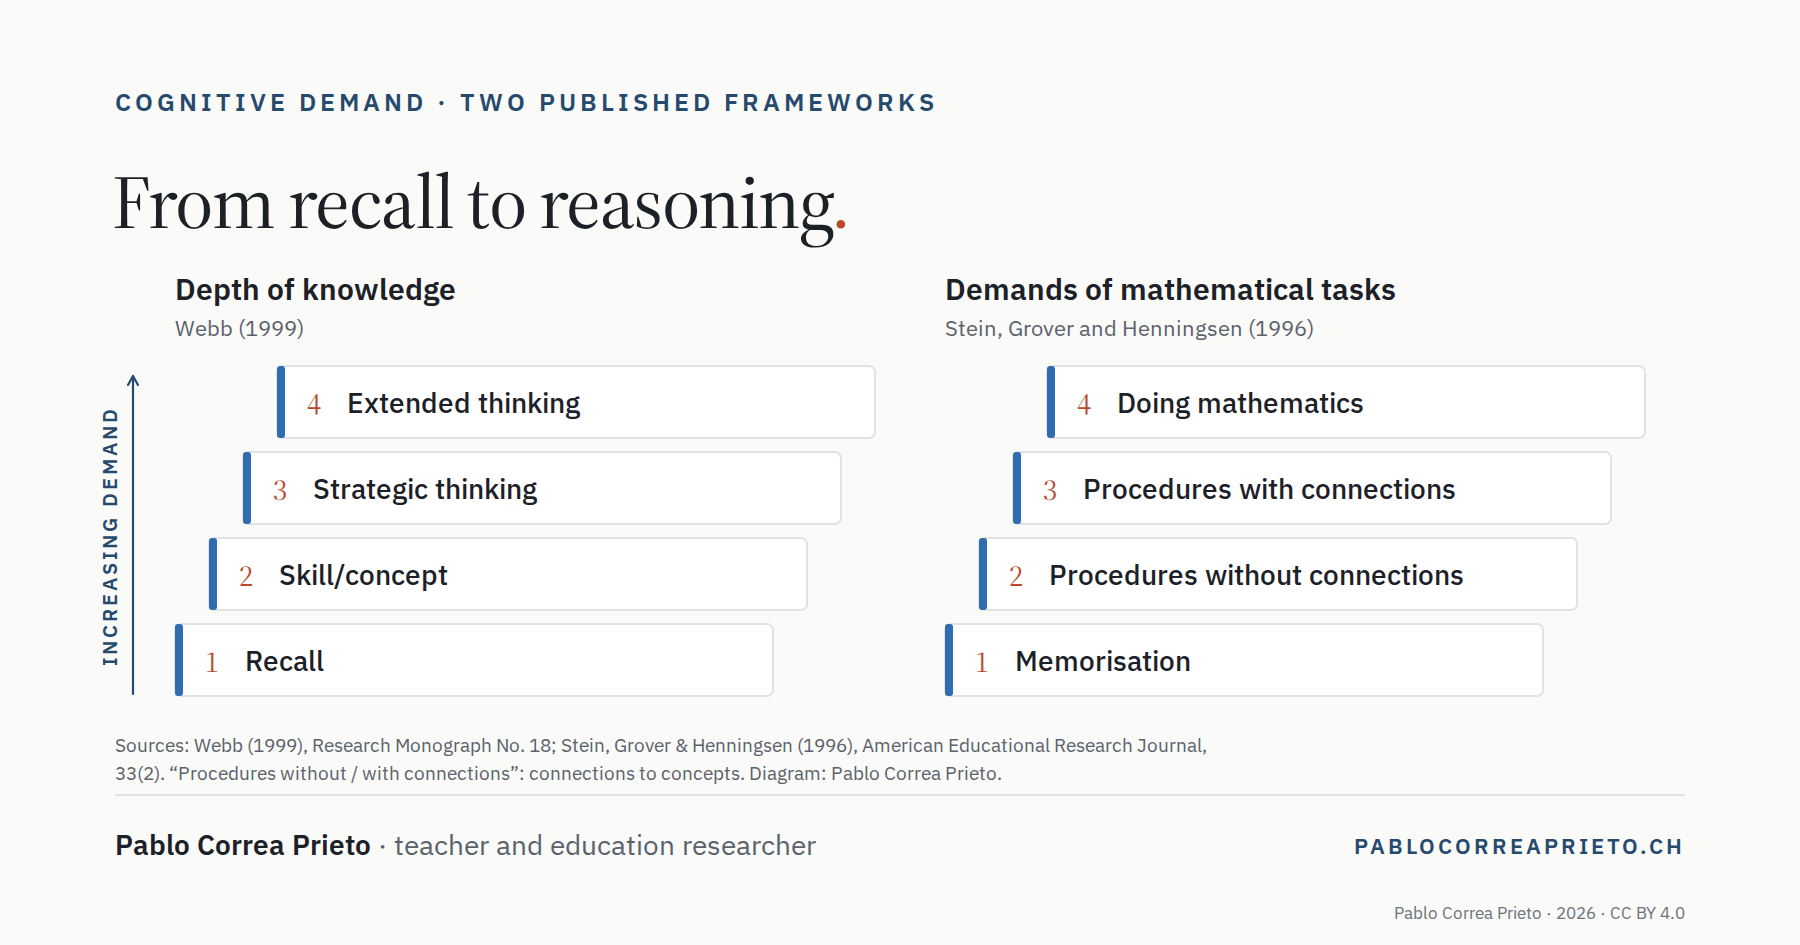
Two four-level scales of cognitive demand: Webb’s (recall, skill/concept, strategic thinking, extended thinking) and Stein, Grover and Henningsen’s (memorisation, procedures without connections, procedures with connections, doing mathematics)
Two published frameworks for describing cognitive demand, from recall to reasoning.
© Pablo Correa Prieto, 2026 — CC BY 4.0

Protect the effort that makes learning happen: what to hand to AI, what to keep demanding
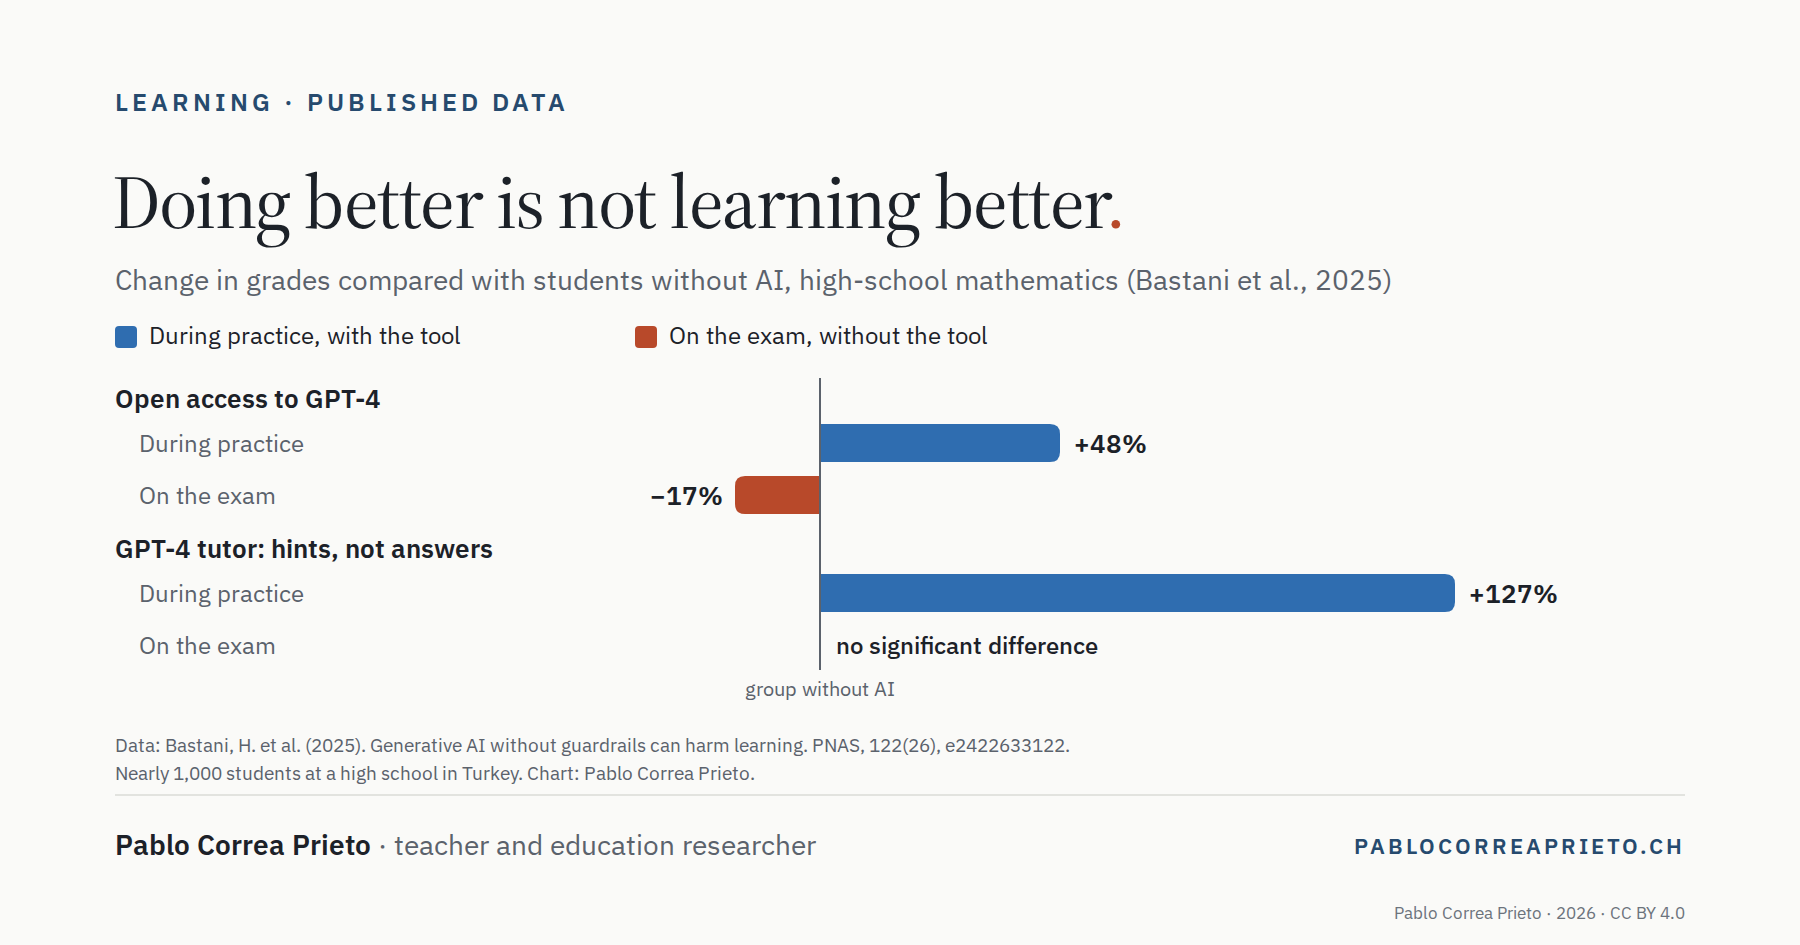
Bar chart: with open access to GPT-4, grades rose by 48% during practice but fell by 17% on the exam; with a tutor giving hints, they rose by 127% during practice, with no significant difference on the exam
Doing better during practice does not guarantee doing better on the exam. Data: Bastani et al. (2025).
© Pablo Correa Prieto, 2026 — CC BY 4.0
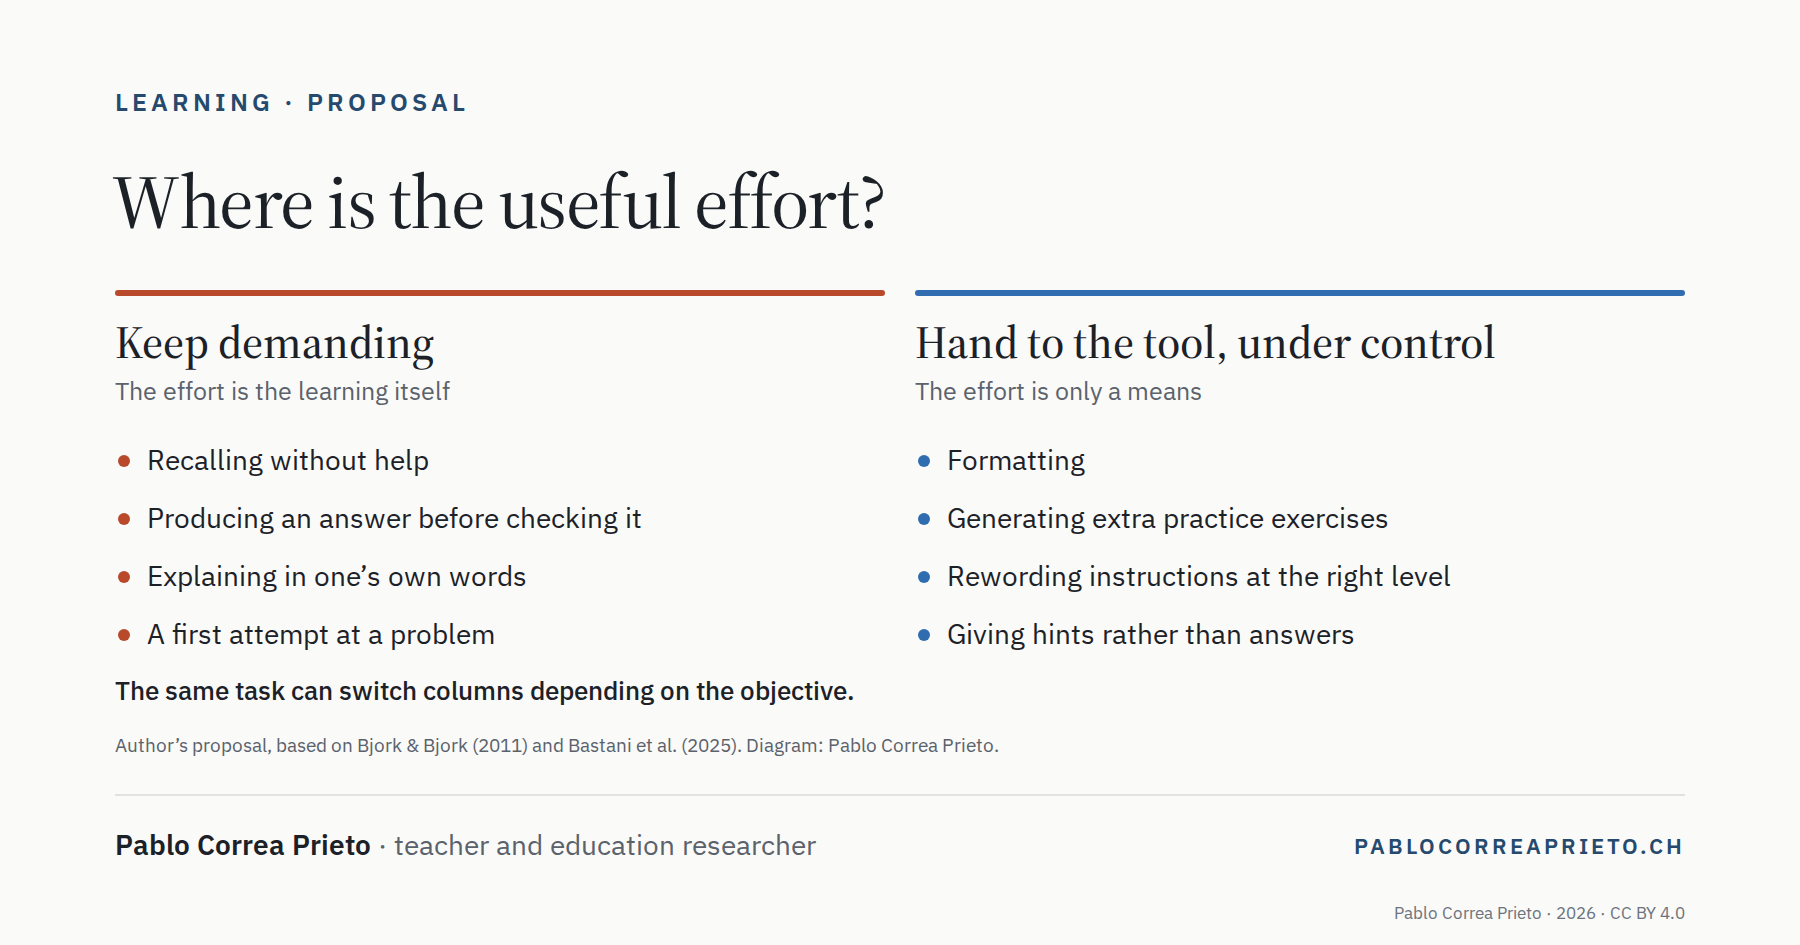
Two columns: what to keep demanding (recalling without help, producing an answer, explaining in one’s own words, a first attempt) and what can be handed to the tool under control (formatting, extra exercises, rewording instructions, hints rather than answers)
Where the useful effort lies: a proposal for sorting tasks.
© Pablo Correa Prieto, 2026 — CC BY 4.0

Preparing fast with AI: the real work is checking
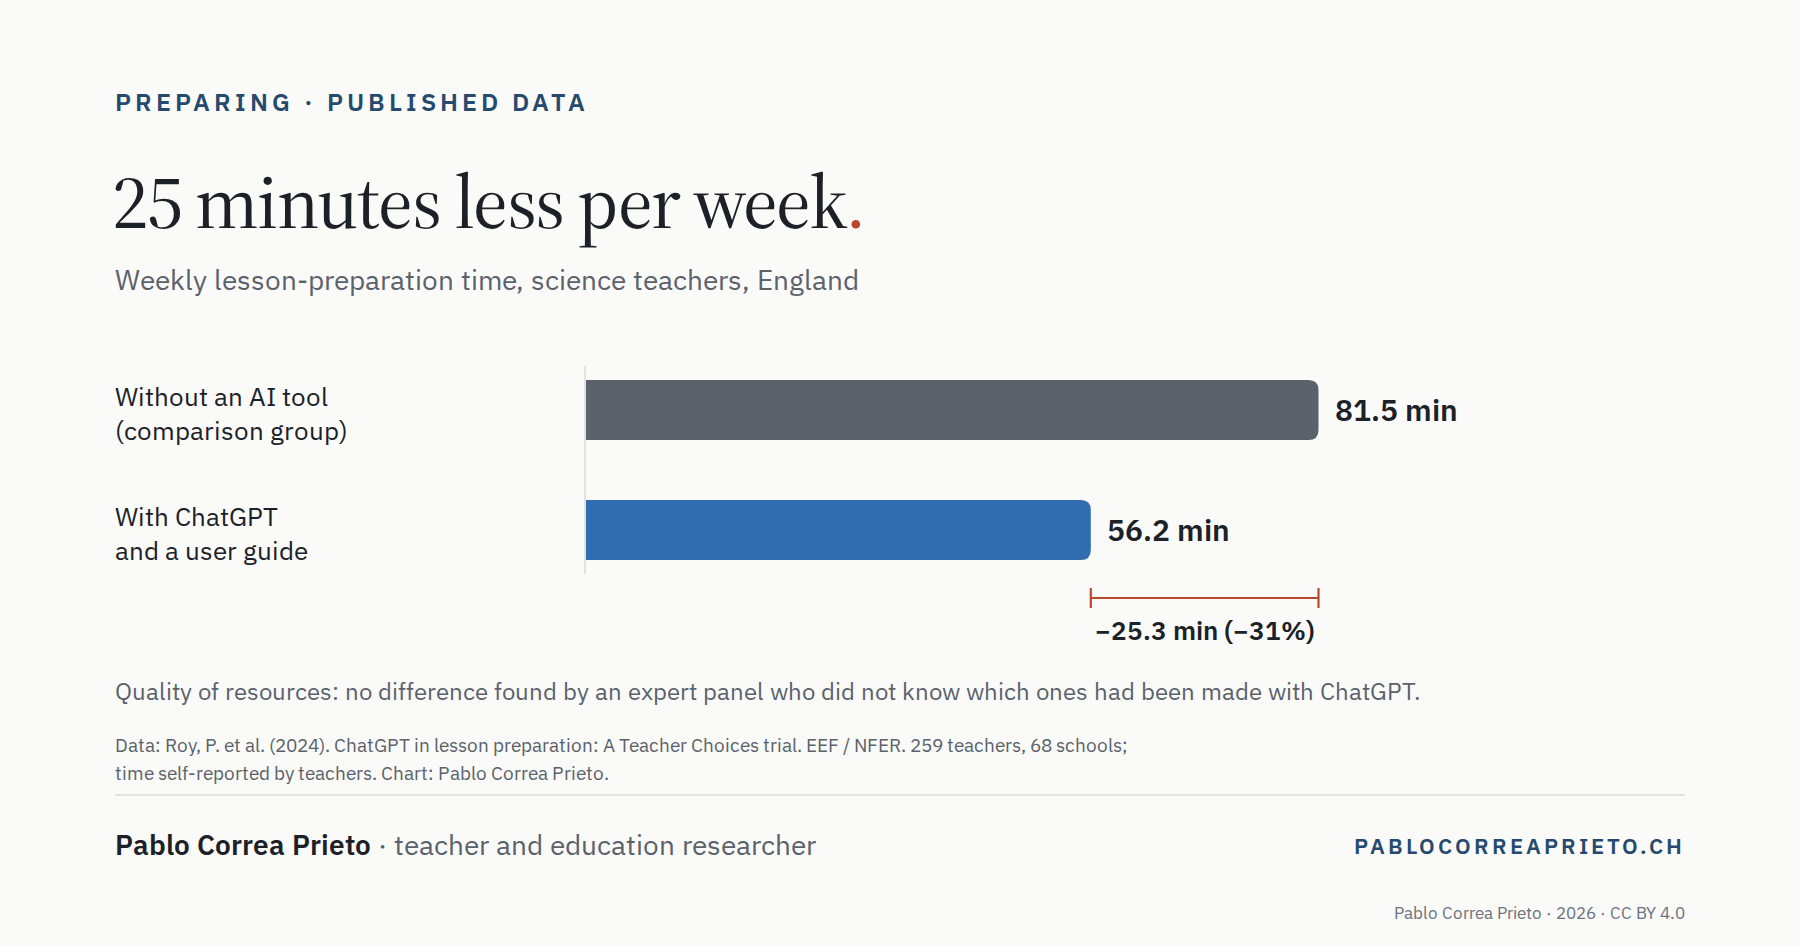
Bar chart: weekly preparation time of 81.5 minutes without an AI tool and 56.2 minutes with ChatGPT and a guide, 25.3 minutes less (−31%)
The time saving measured in a controlled trial in England. Data: Roy et al. (2024).
© Pablo Correa Prieto, 2026 — CC BY 4.0
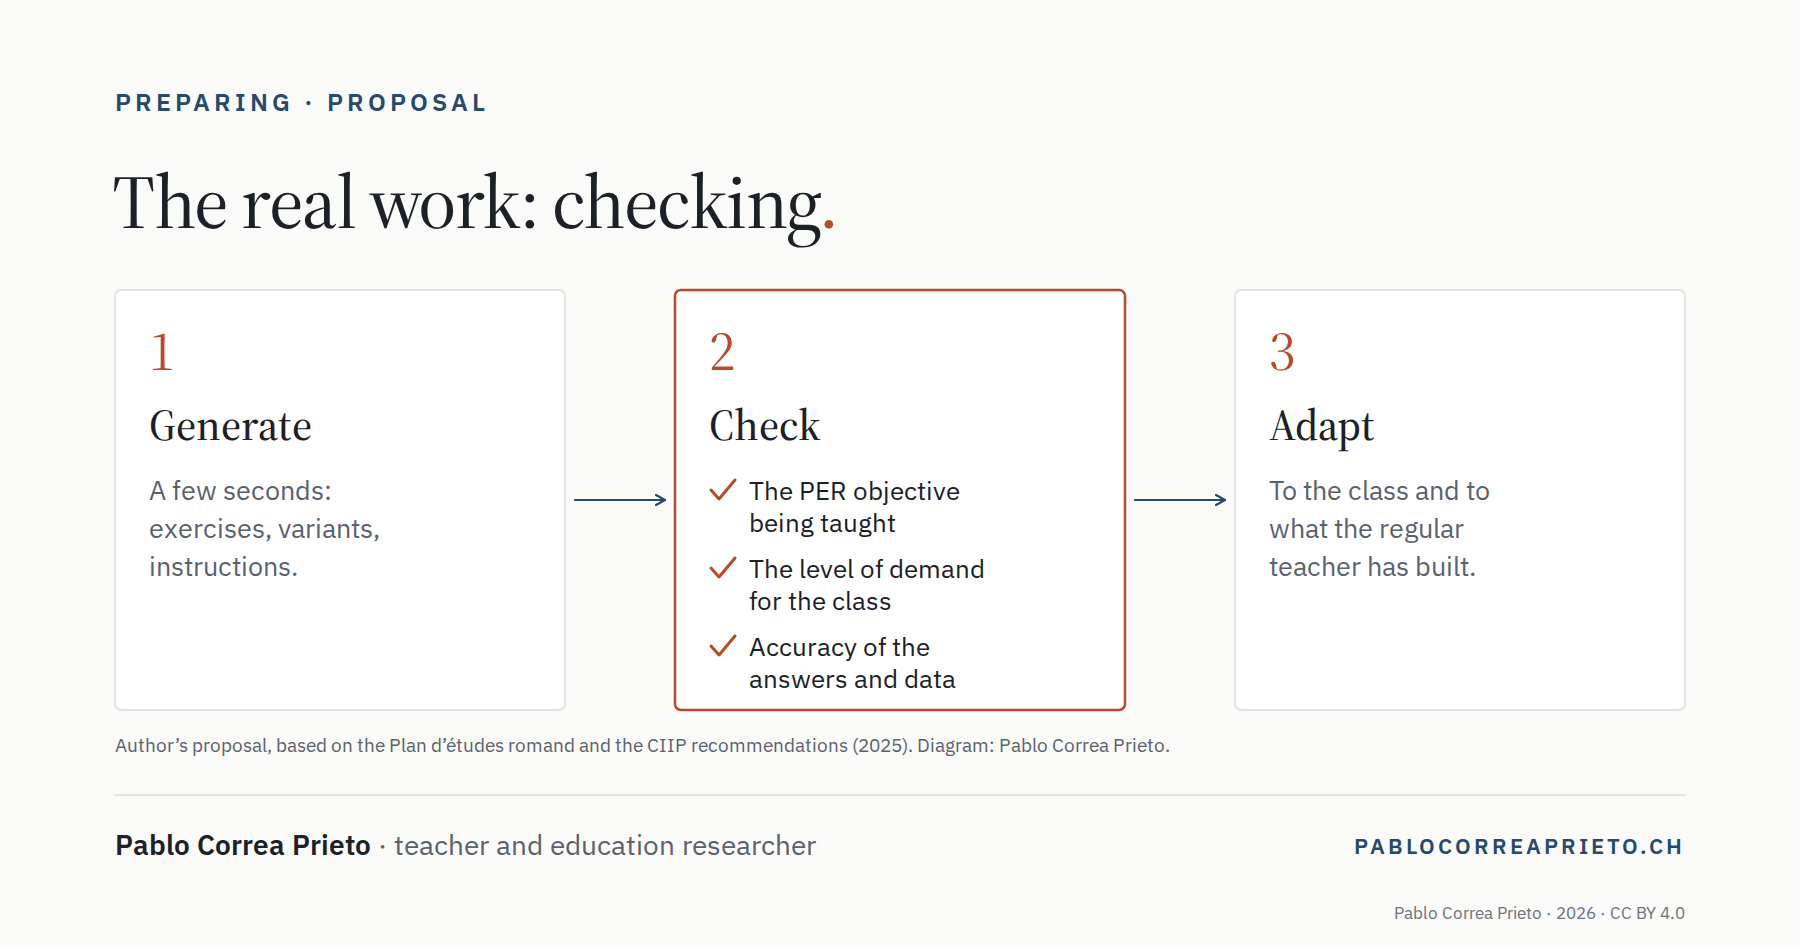
Three numbered steps: generate, check (PER objective, level of demand, accuracy) and adapt to the class; the checking step is highlighted
Check the objective, the level of demand and accuracy, then adapt to the class.
© Pablo Correa Prieto, 2026 — CC BY 4.0

What AI really changes for teachers who prepare and assess
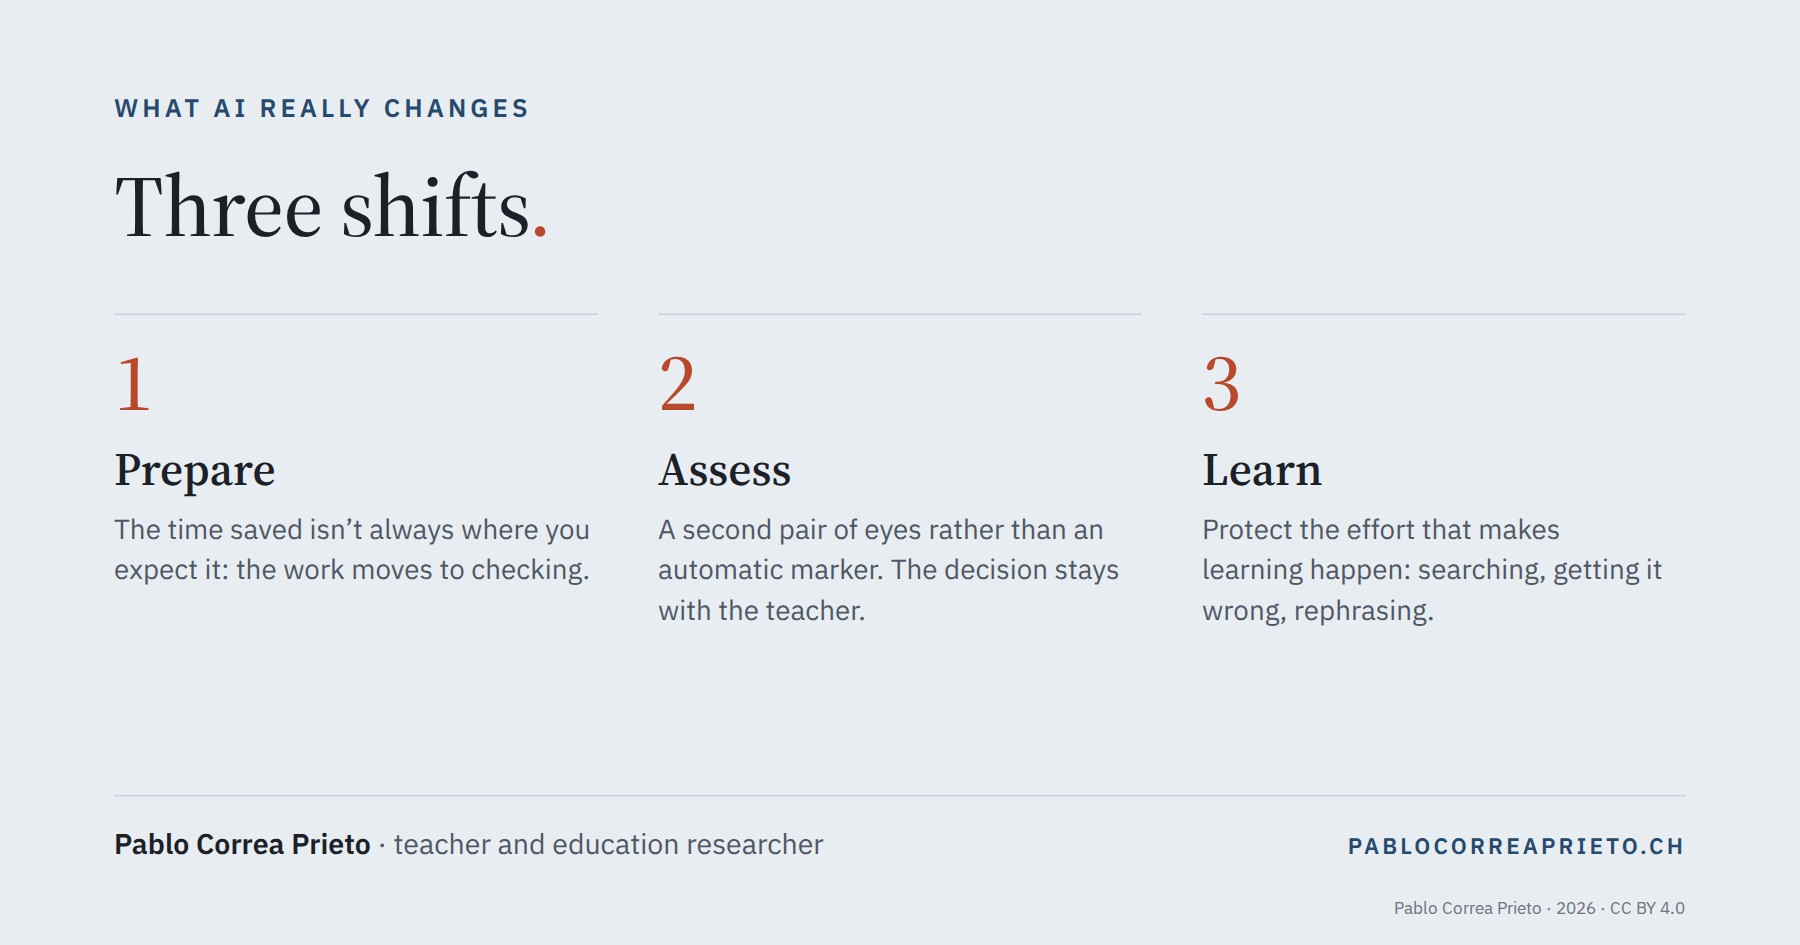
Three numbered columns, “Prepare”, “Assess” and “Learn”, each summed up in one sentence
The three shifts at a glance.
© Pablo Correa Prieto, 2026 — CC BY 4.0

Research programme
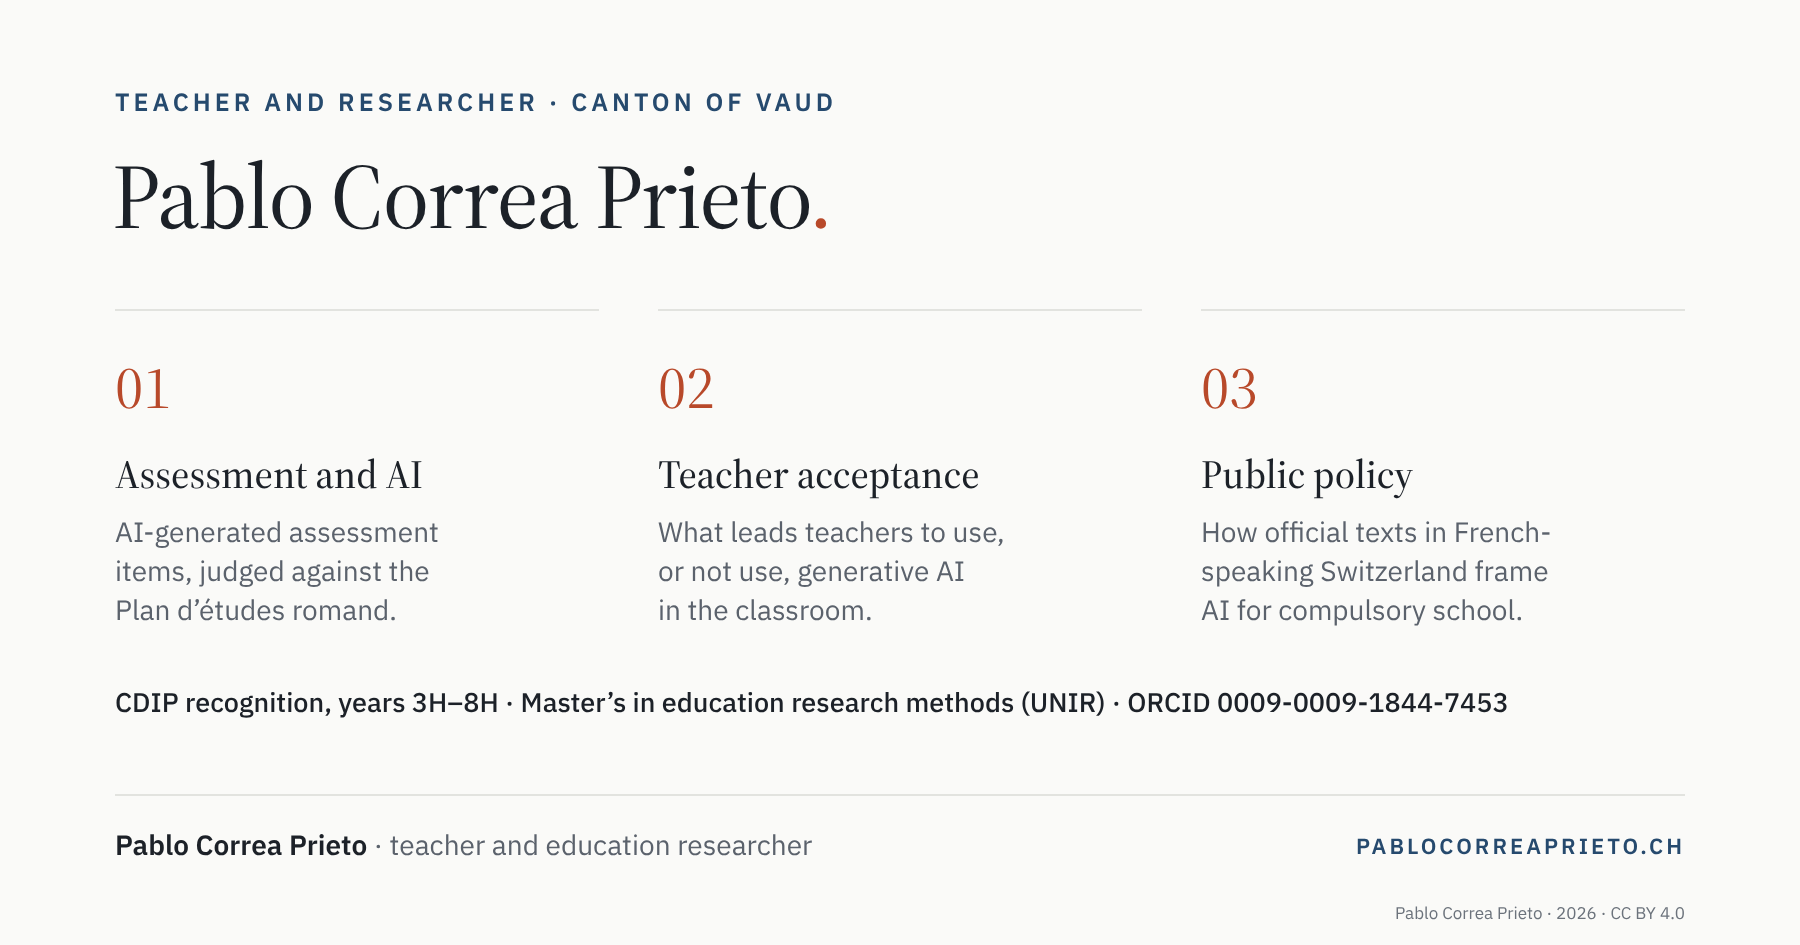
Presentation card of Pablo Correa Prieto, teacher and researcher in the canton of Vaud, with his three strands of work: assessment and AI, teacher acceptance, public policy
Teacher and education researcher in the canton of Vaud: three strands of work.
© Pablo Correa Prieto, 2026 — CC BY 4.0
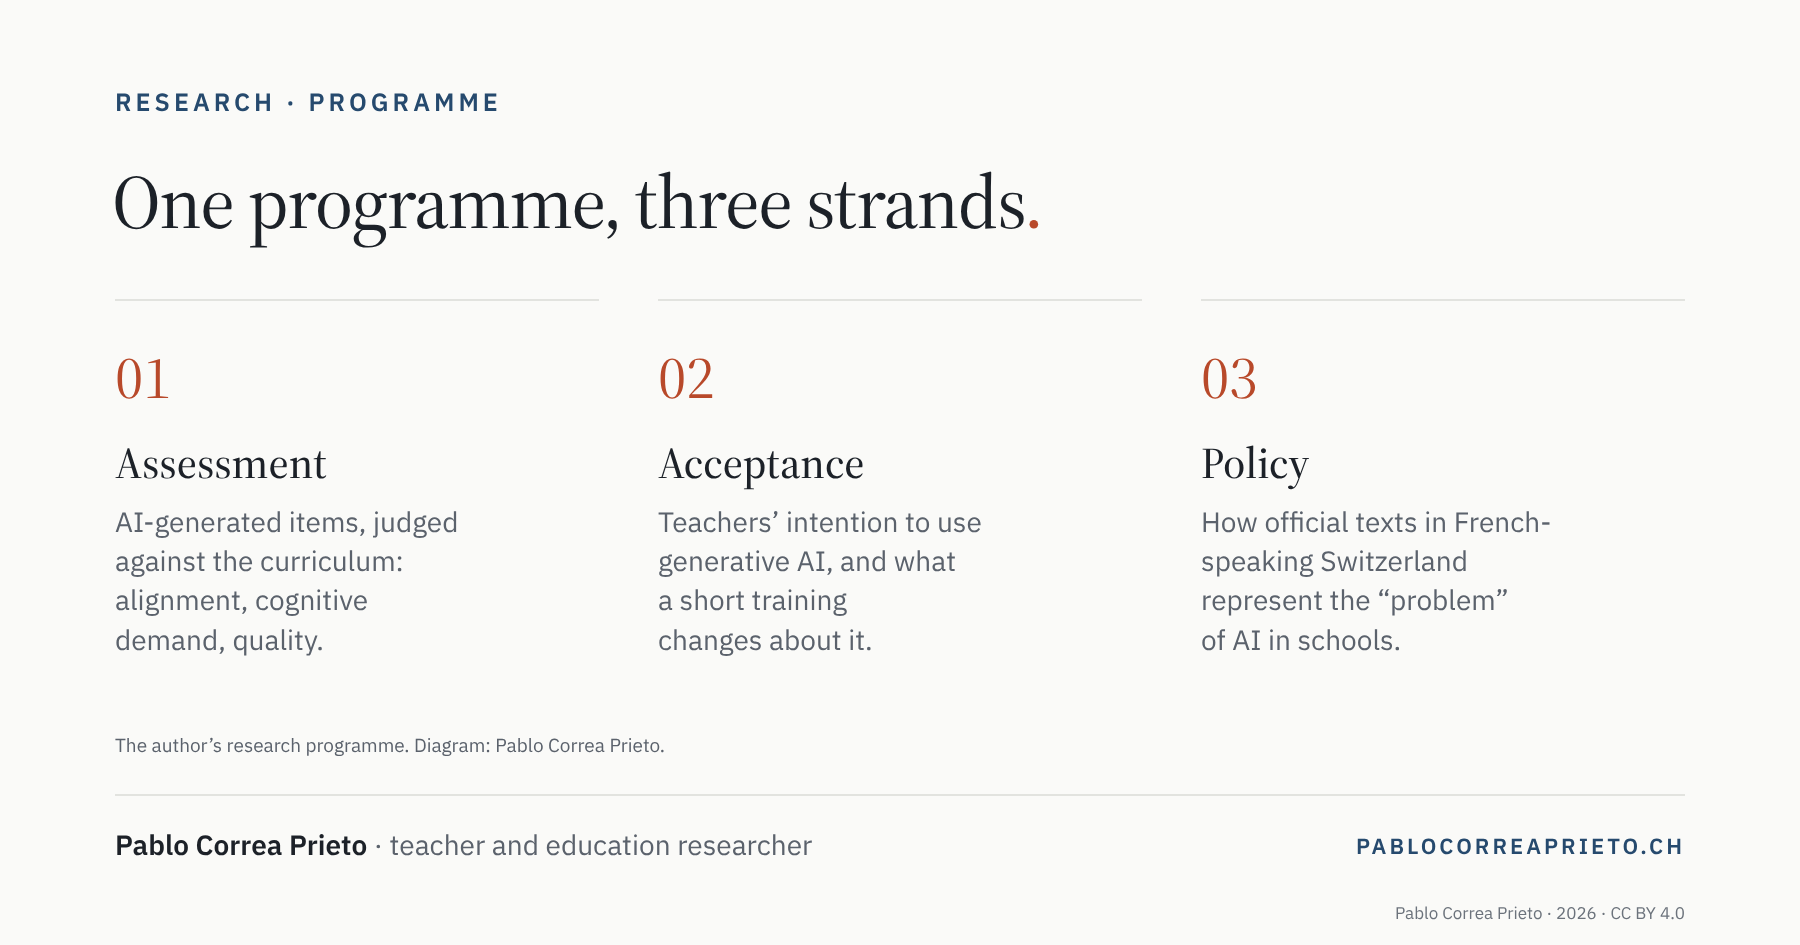
Three columns presenting the three strands of the research programme: AI-generated assessment items, teachers’ intention to use generative AI, analysis of official texts
The research programme in three strands: assessment, acceptance, policy.
© Pablo Correa Prieto, 2026 — CC BY 4.0
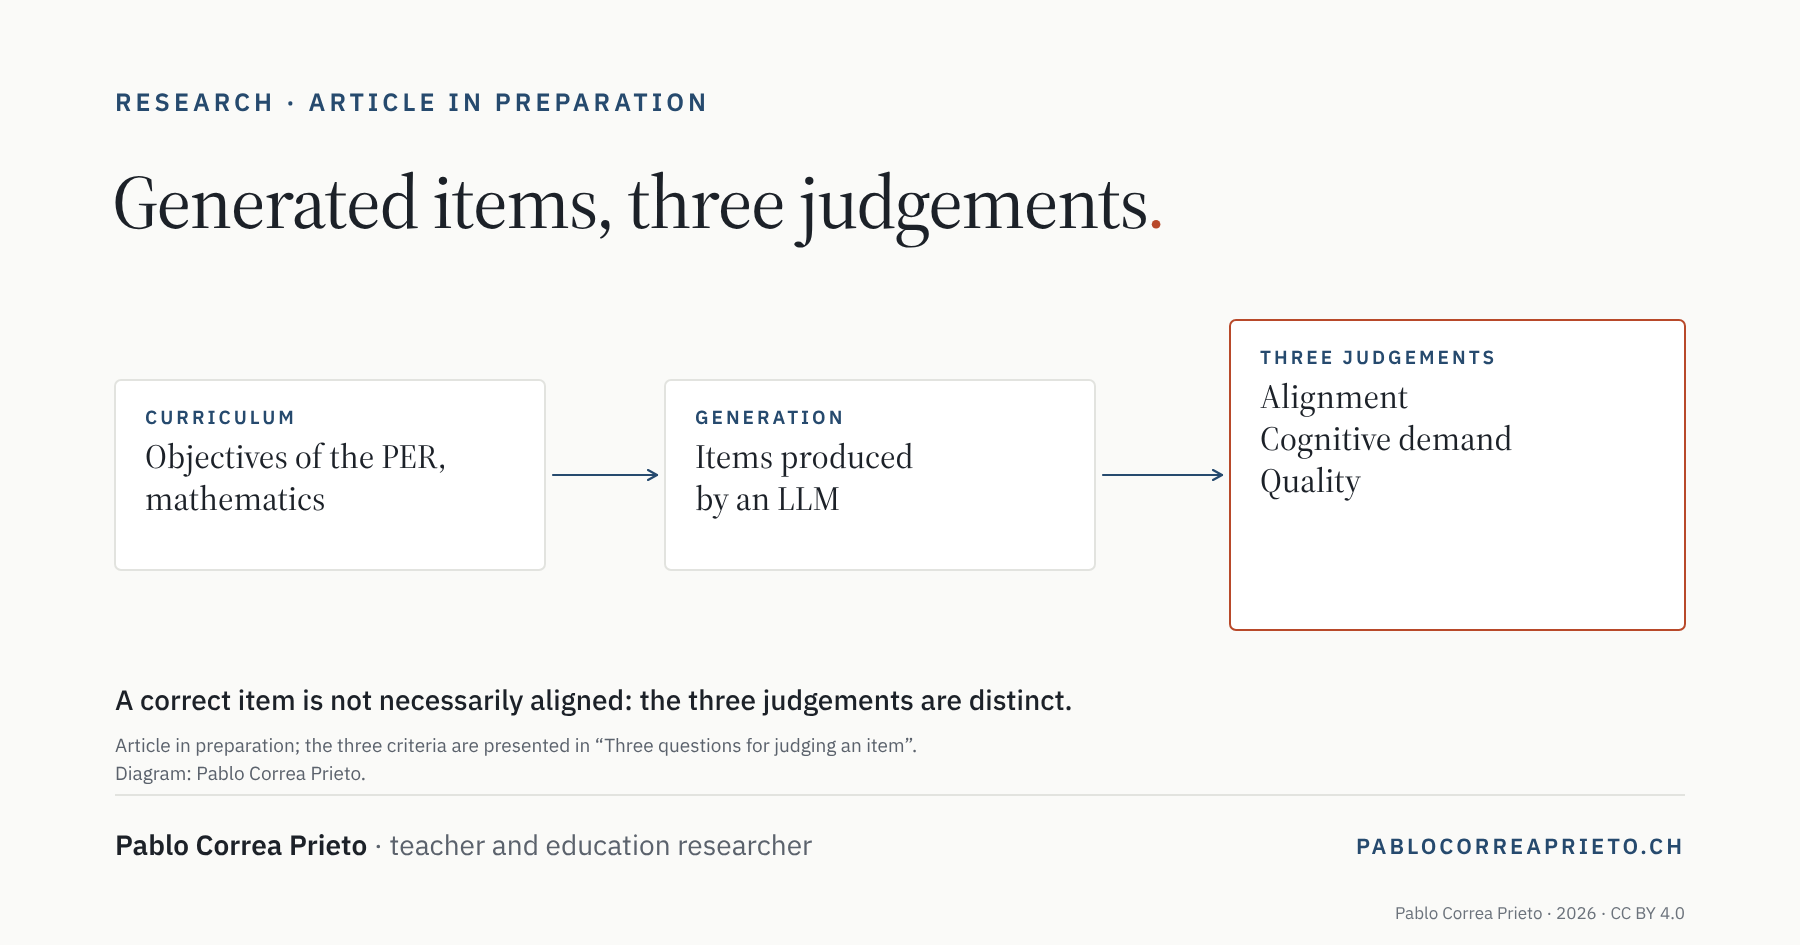
Three-step diagram: objectives of the PER in mathematics, items produced by a large language model, then three distinct judgements — alignment, cognitive demand, quality
Items generated by an LLM, judged three times: alignment, cognitive demand, quality. Article in preparation.
© Pablo Correa Prieto, 2026 — CC BY 4.0
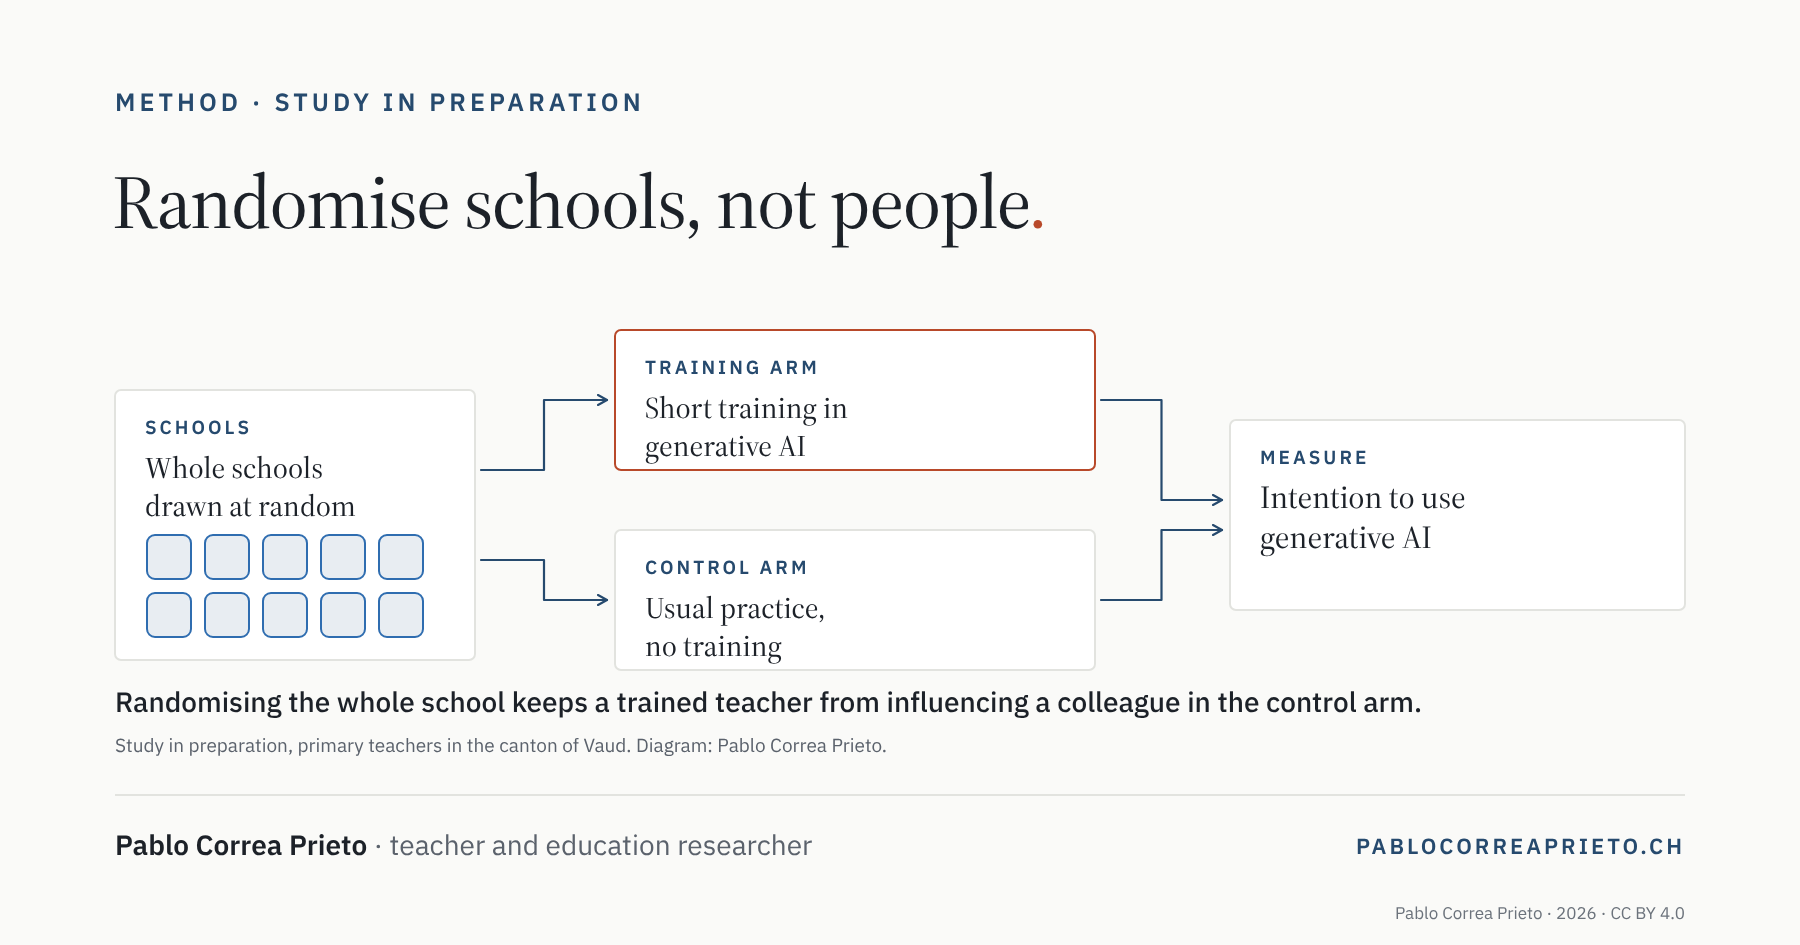
Diagram of a cluster-randomised trial: whole schools drawn at random into a training arm or a control arm, with the intention to use generative AI as the measure
The planned cluster-randomised trial: randomise schools, not people.
© Pablo Correa Prieto, 2026 — CC BY 4.0
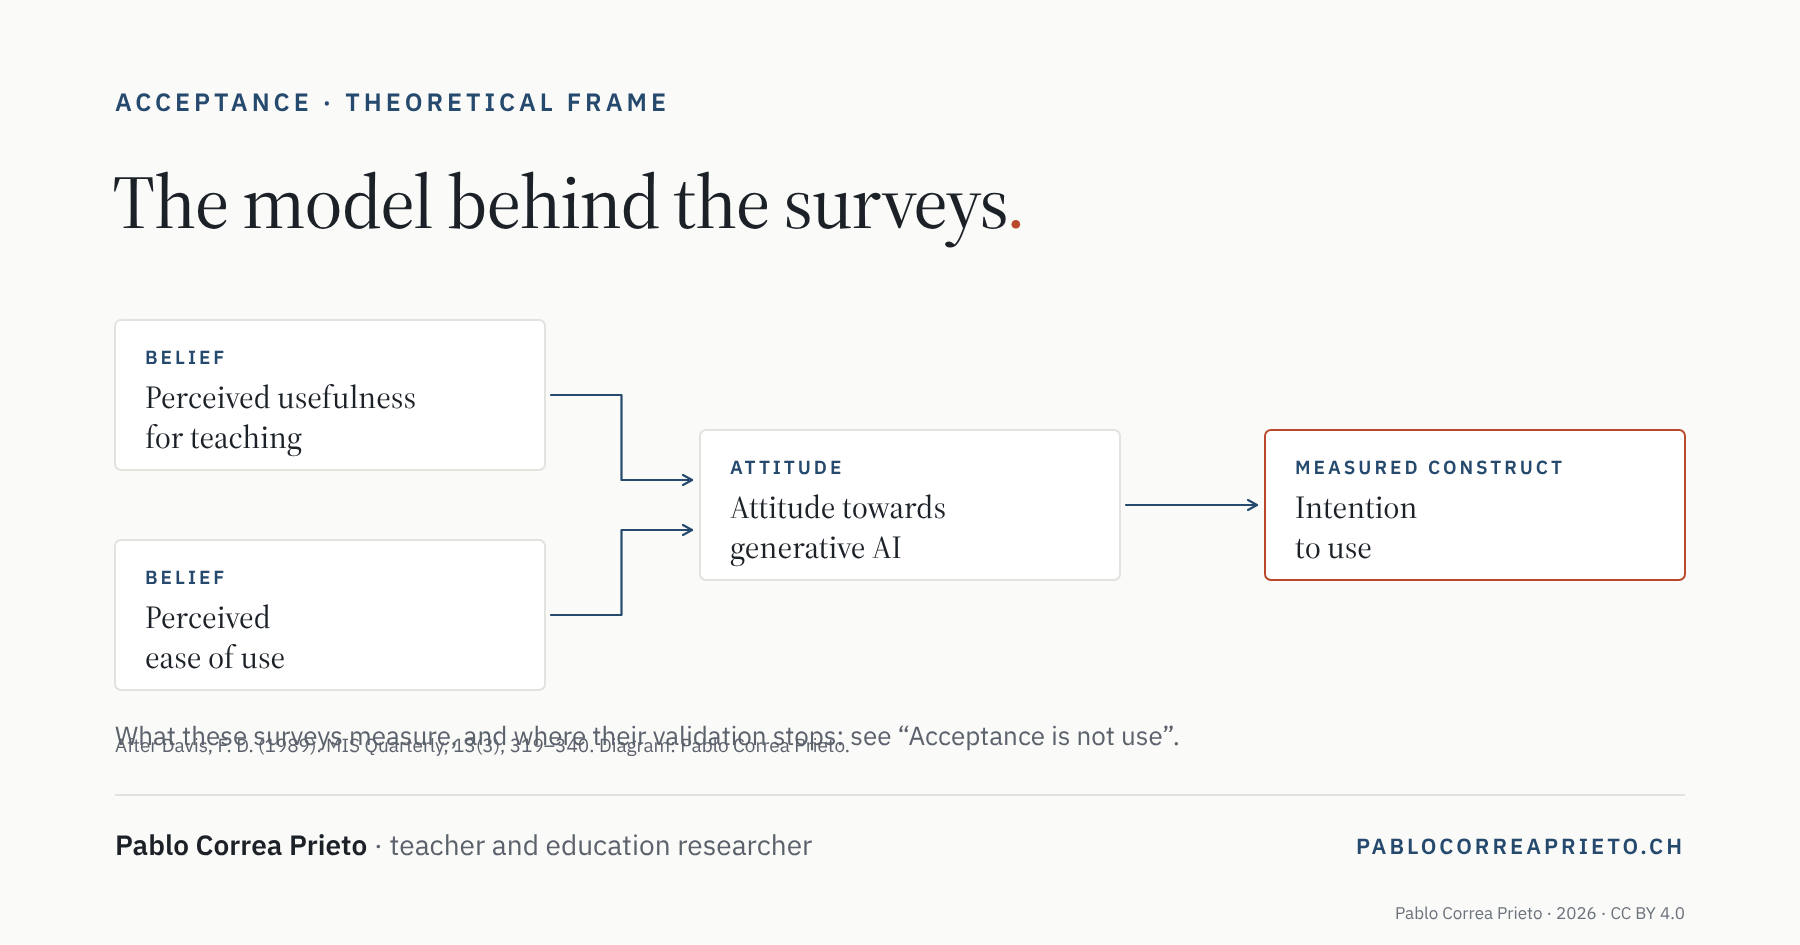
Diagram of the technology acceptance model: perceived usefulness and perceived ease of use lead to the attitude towards generative AI, then to the intention to use it
The technology acceptance model, after Davis (1989).
© Pablo Correa Prieto, 2026 — CC BY 4.0
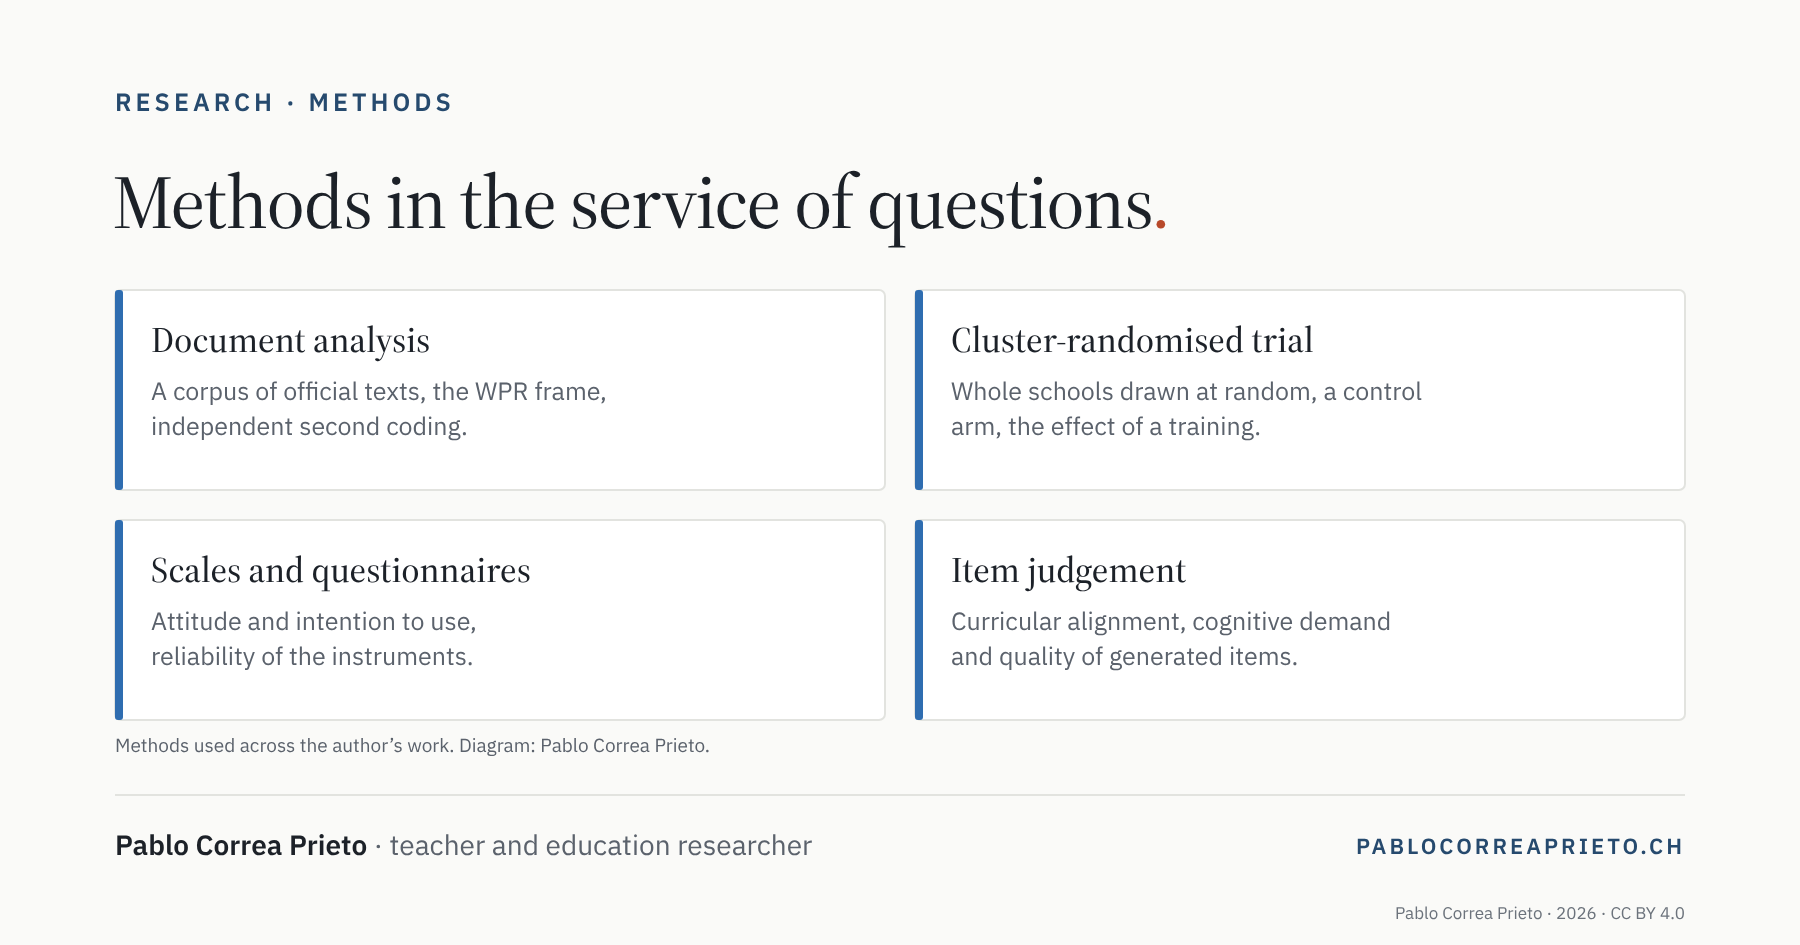
Four methods used across the programme: document analysis, a cluster-randomised trial, scales and questionnaires, item judgement
The methods used across the programme.
© Pablo Correa Prieto, 2026 — CC BY 4.0

AI in the Swiss texts
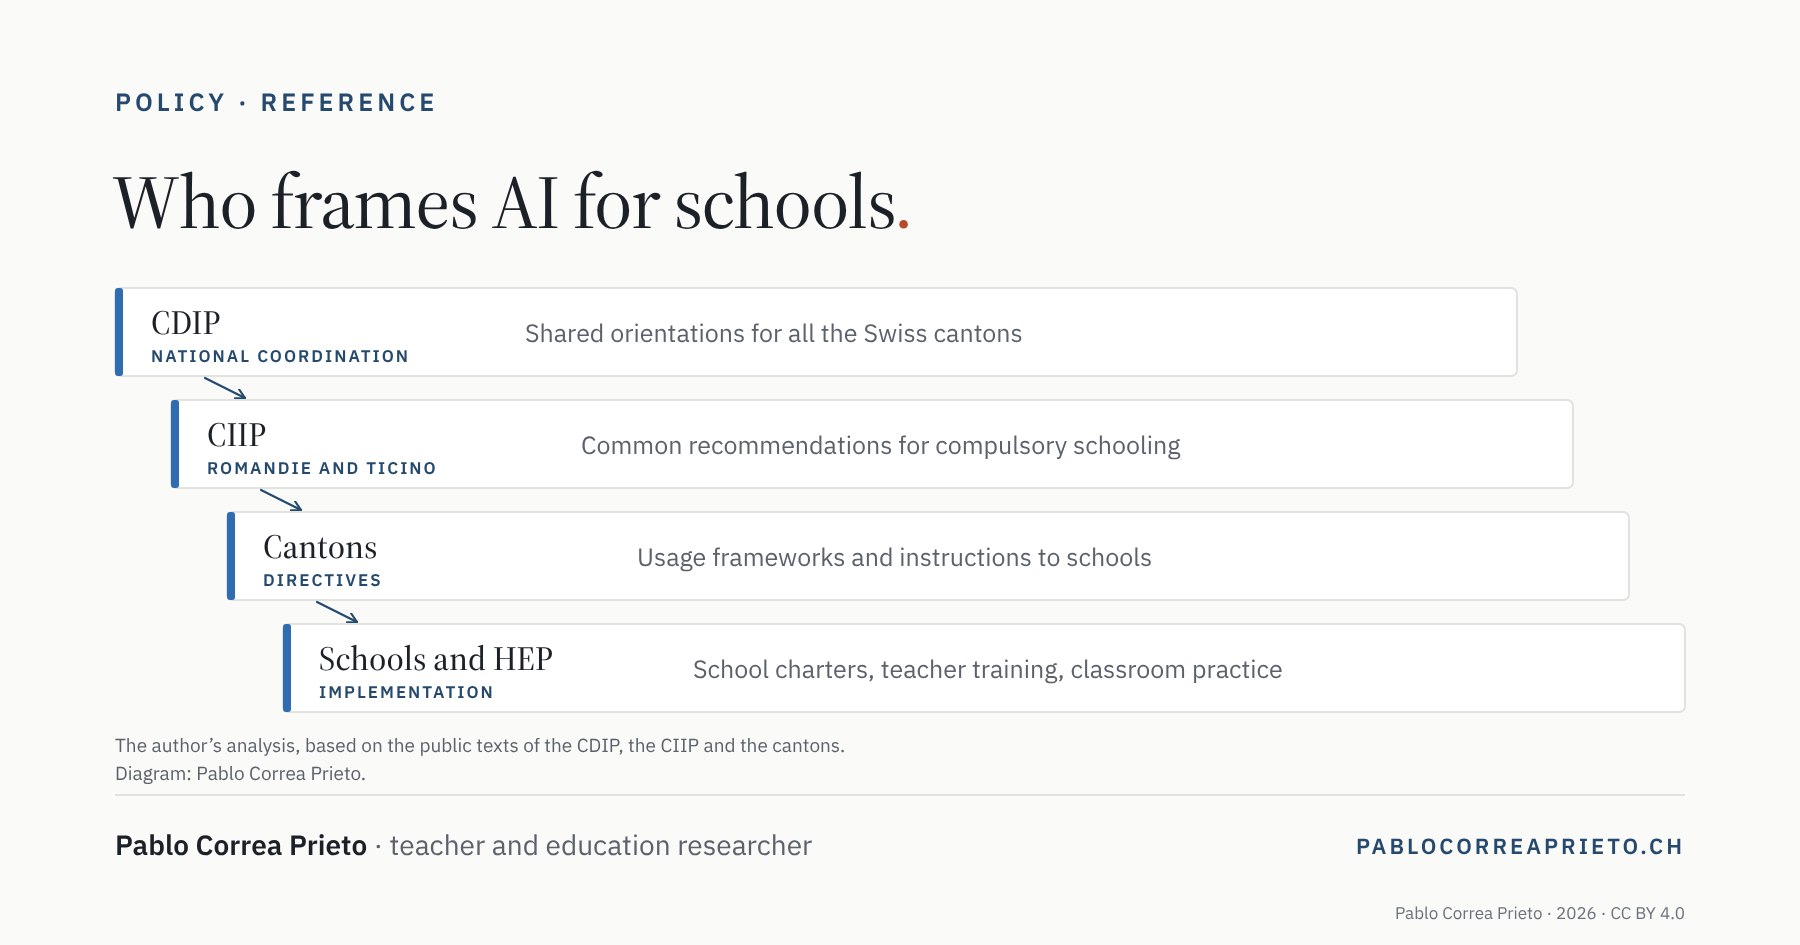
Four levels of texts framing AI for schools: the CDIP at national level, the CIIP for Romandie and Ticino, cantonal directives, then schools and teacher-training institutions
Four levels of texts, from national principle to classroom practice.
© Pablo Correa Prieto, 2026 — CC BY 4.0
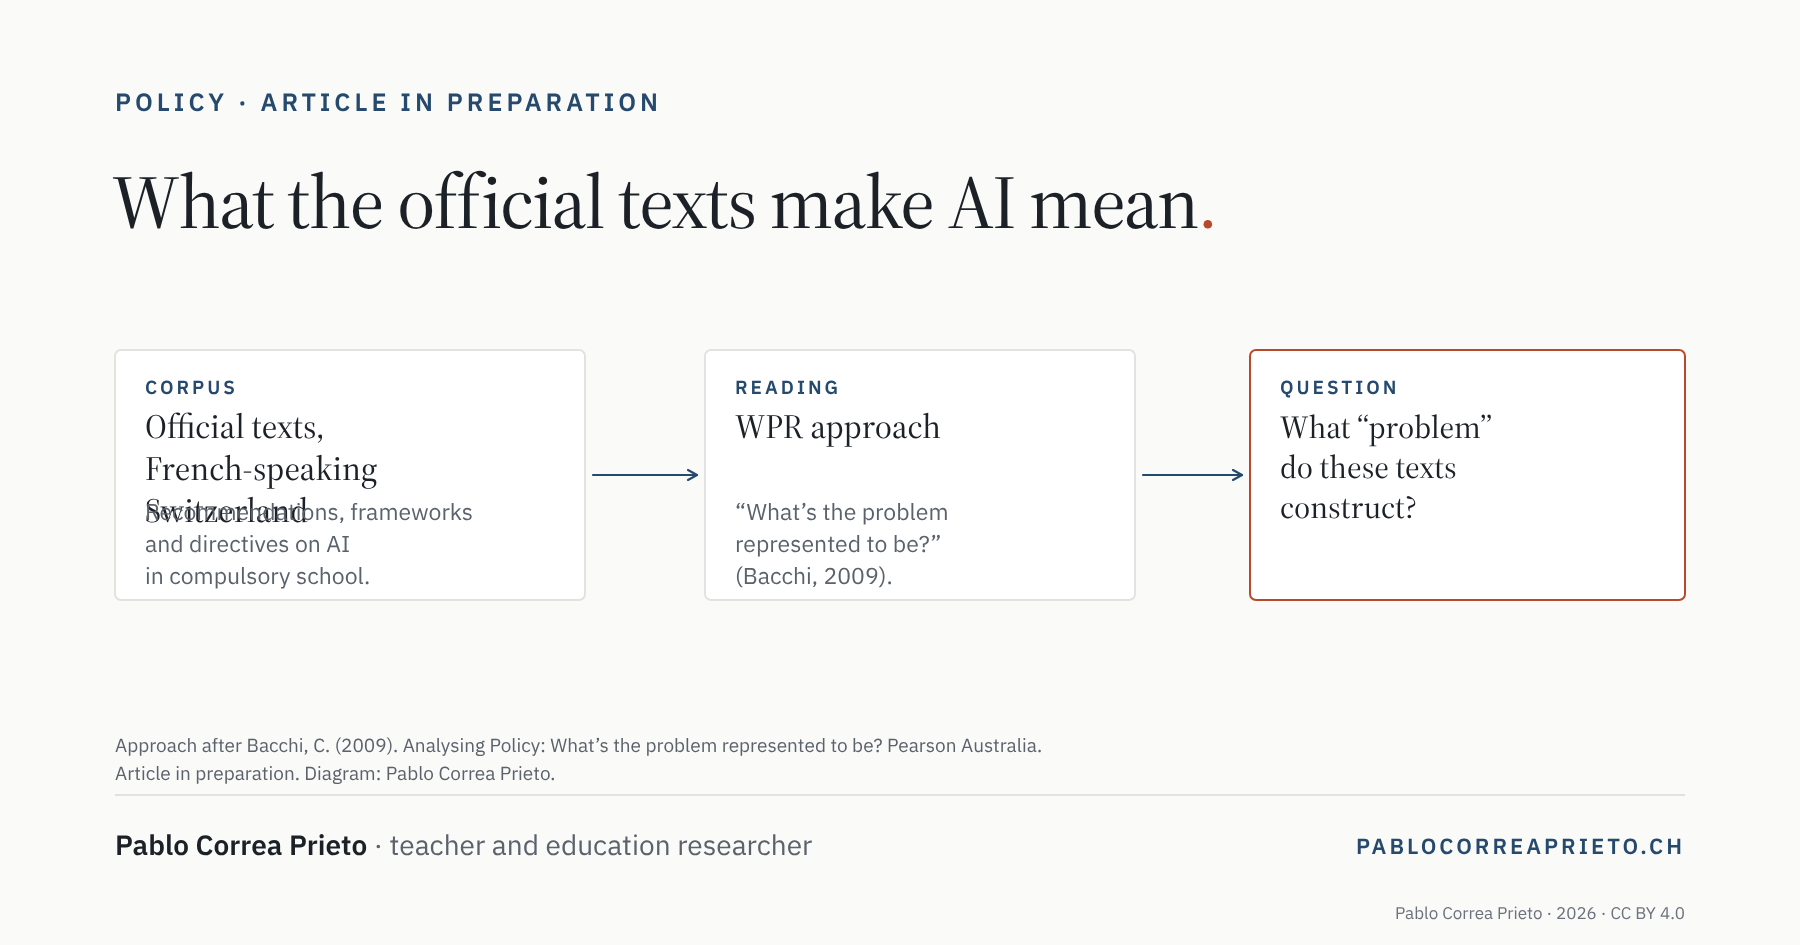
Diagram: a corpus of official texts on AI in French-speaking Switzerland, read with Bacchi’s WPR approach, leading to the question of the “problem” these texts construct
A corpus of official texts, read with the WPR approach (Bacchi, 2009). Article in preparation.
© Pablo Correa Prieto, 2026 — CC BY 4.0
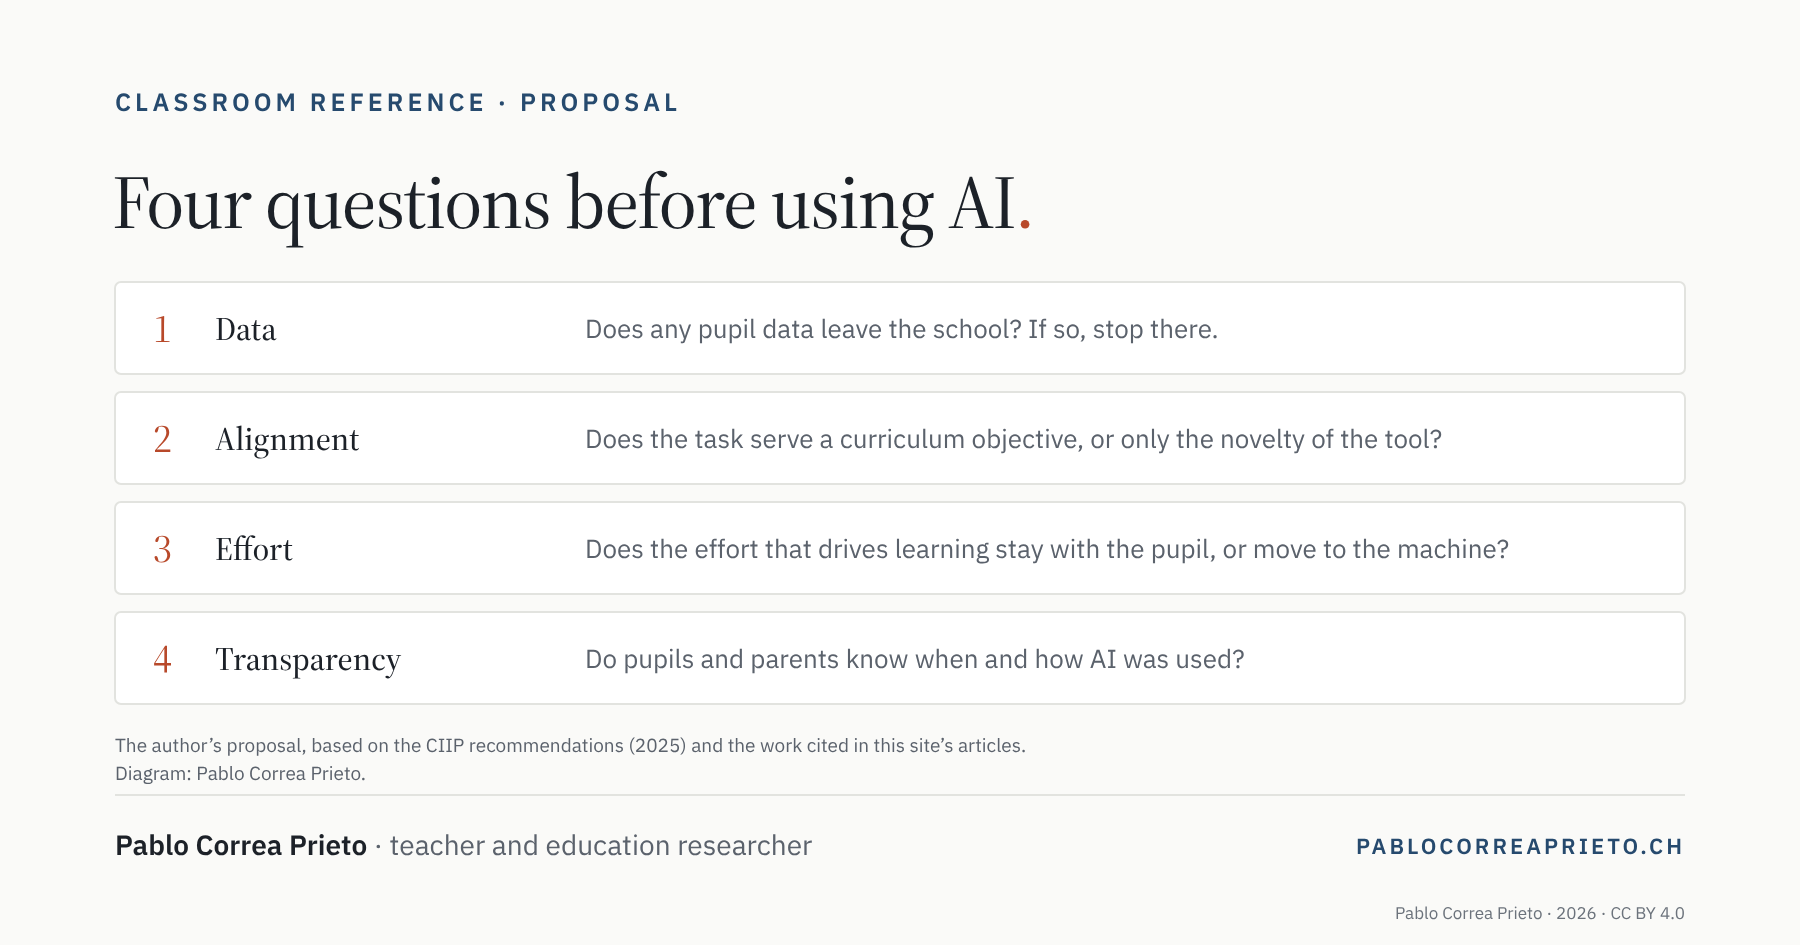
Four questions to ask before using AI in class: pupil data, alignment with the curriculum, the effort that drives learning, and transparency
Four questions before using AI in class. The author’s proposal.
© Pablo Correa Prieto, 2026 — CC BY 4.0

Training
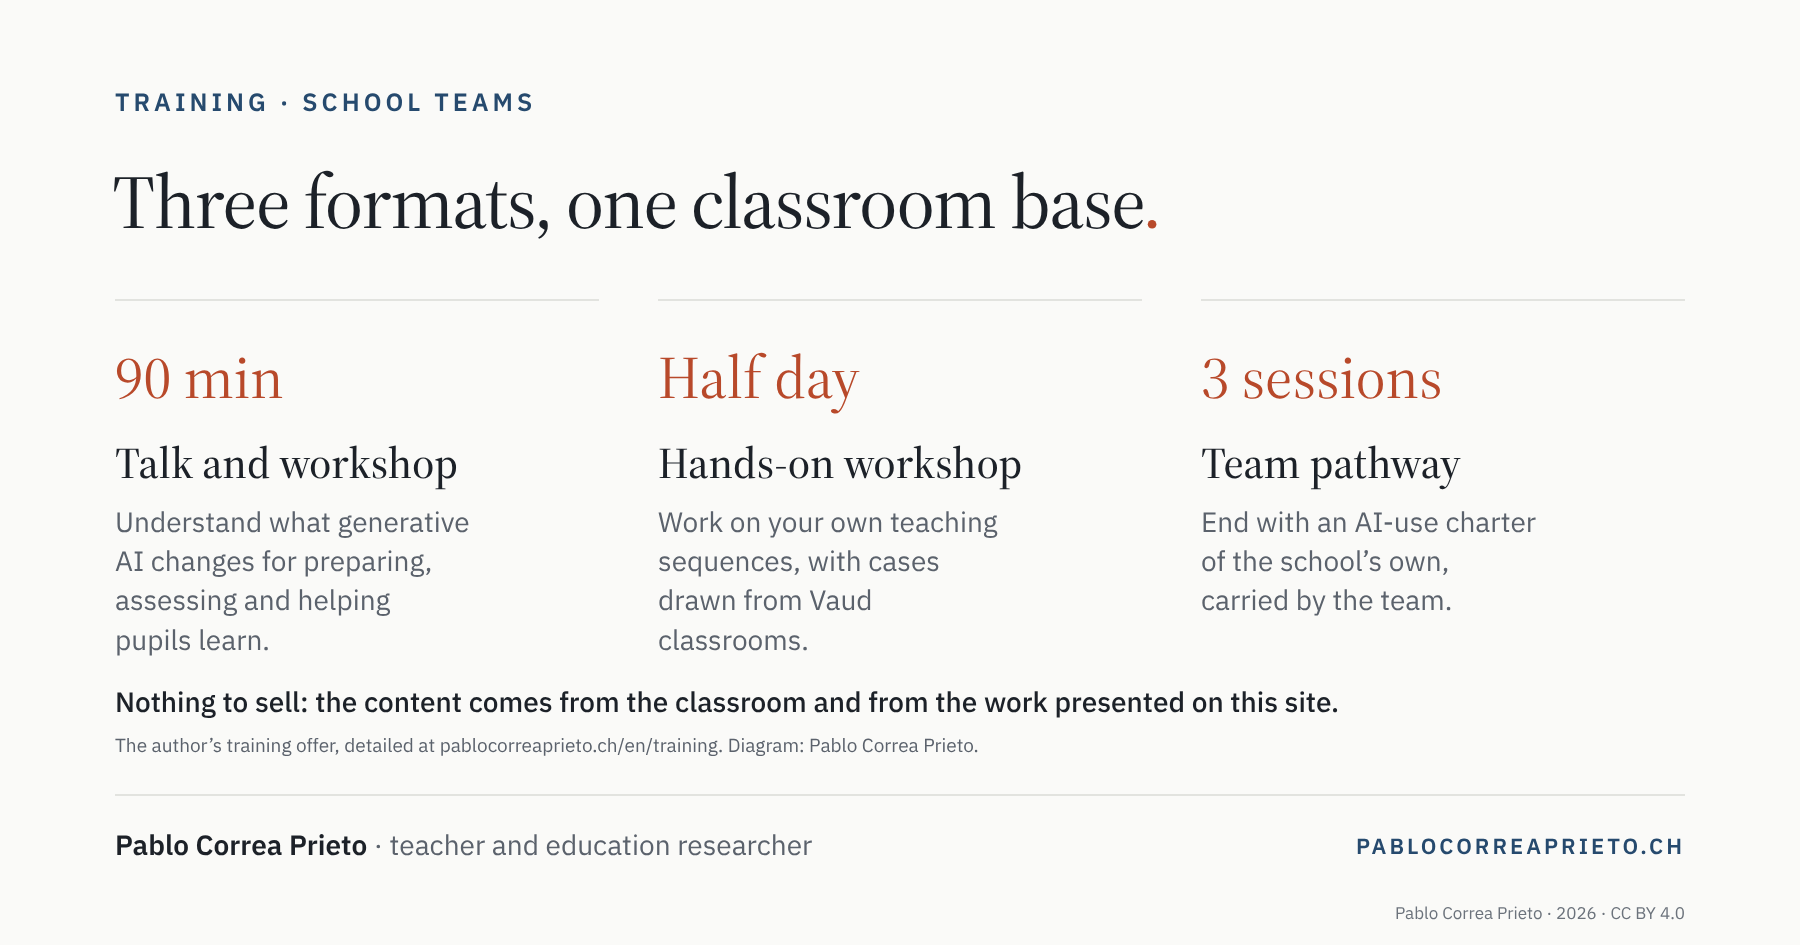
Three training formats for school teams: a 90-minute talk and workshop, a half-day hands-on workshop, and a three-session team pathway ending with an AI-use charter
Three training formats for schools in the canton of Vaud and French-speaking Switzerland.
© Pablo Correa Prieto, 2026 — CC BY 4.0